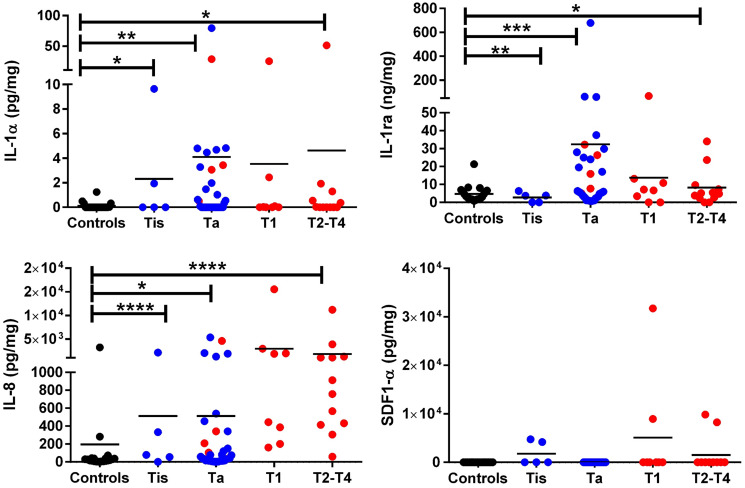
Figure 3. ELISA validation of IL-1α, IL-1ra, IL-8, and SDF-1α in bladder cancer patients with varying clinical stages.
The dot plots depict the expression of IL-1α, IL-1ra, IL-8, and SDF-1α in urine from different stages of BC. Included were 20 urology clinic controls (“controls”), 35 Ta, 5 Tis, 8 T1, and 12 T2-T4 BC patients. Creatinine normalized urine protein levels are shown in different colors (black dots = controls, blue dots = low grade BC and red dots = high grade BC). Low grade tumor and high grade tumor classification was based on pathology reports. The asterisks designate the level of significance between the different groups: *= p < 0.05, **= p < 0.01, ***= p < 0.001, and **** = p < 0.0001, using a Mann Whitney U test.

