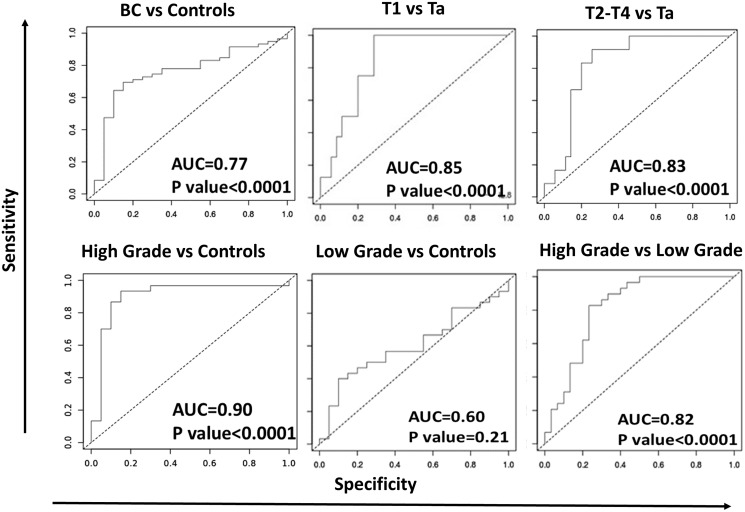
Figure 4. ROC-AUC curves for urine IL-8 in distinguishing different stages of bladder cancer.
ROC-AUC curves were generated for urine IL-8 to determine its discriminatory capability among different BC groups. AUC values and p-values are listed on each curve. The closer the AUC value is to 1, the higher the discriminatory potential of the protein to distinguish between the two sample groups, with maximized sensitivity and specificity. All comparisons exhibited AUC values of 0.77 or higher, with p-values < 0.0001, except for the comparison between low grade versus urology clinic controls.

