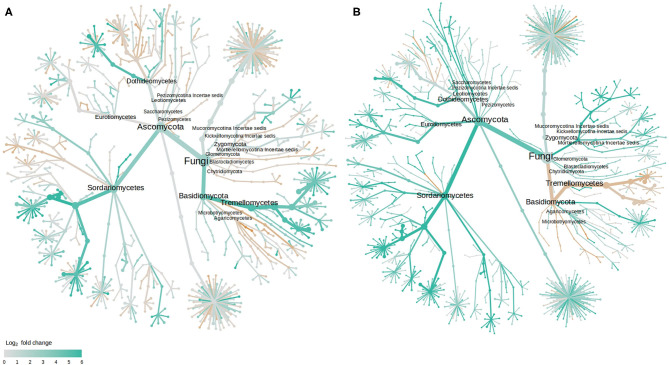
Figure 5.
Tree views of the differences in the fungal abundance in the rhizosphere of healthy and diseased cotton plants: (A) cv. LM28, and (B) cv. ZHM2; the difference in abundance is expressed as log2FoldChange, with values >0 indicating that the abundance of specific OTUs was greater in diseased samples than in healthy samples. Label and node represent the abundance of rhizosphere fungi at the class rank.

