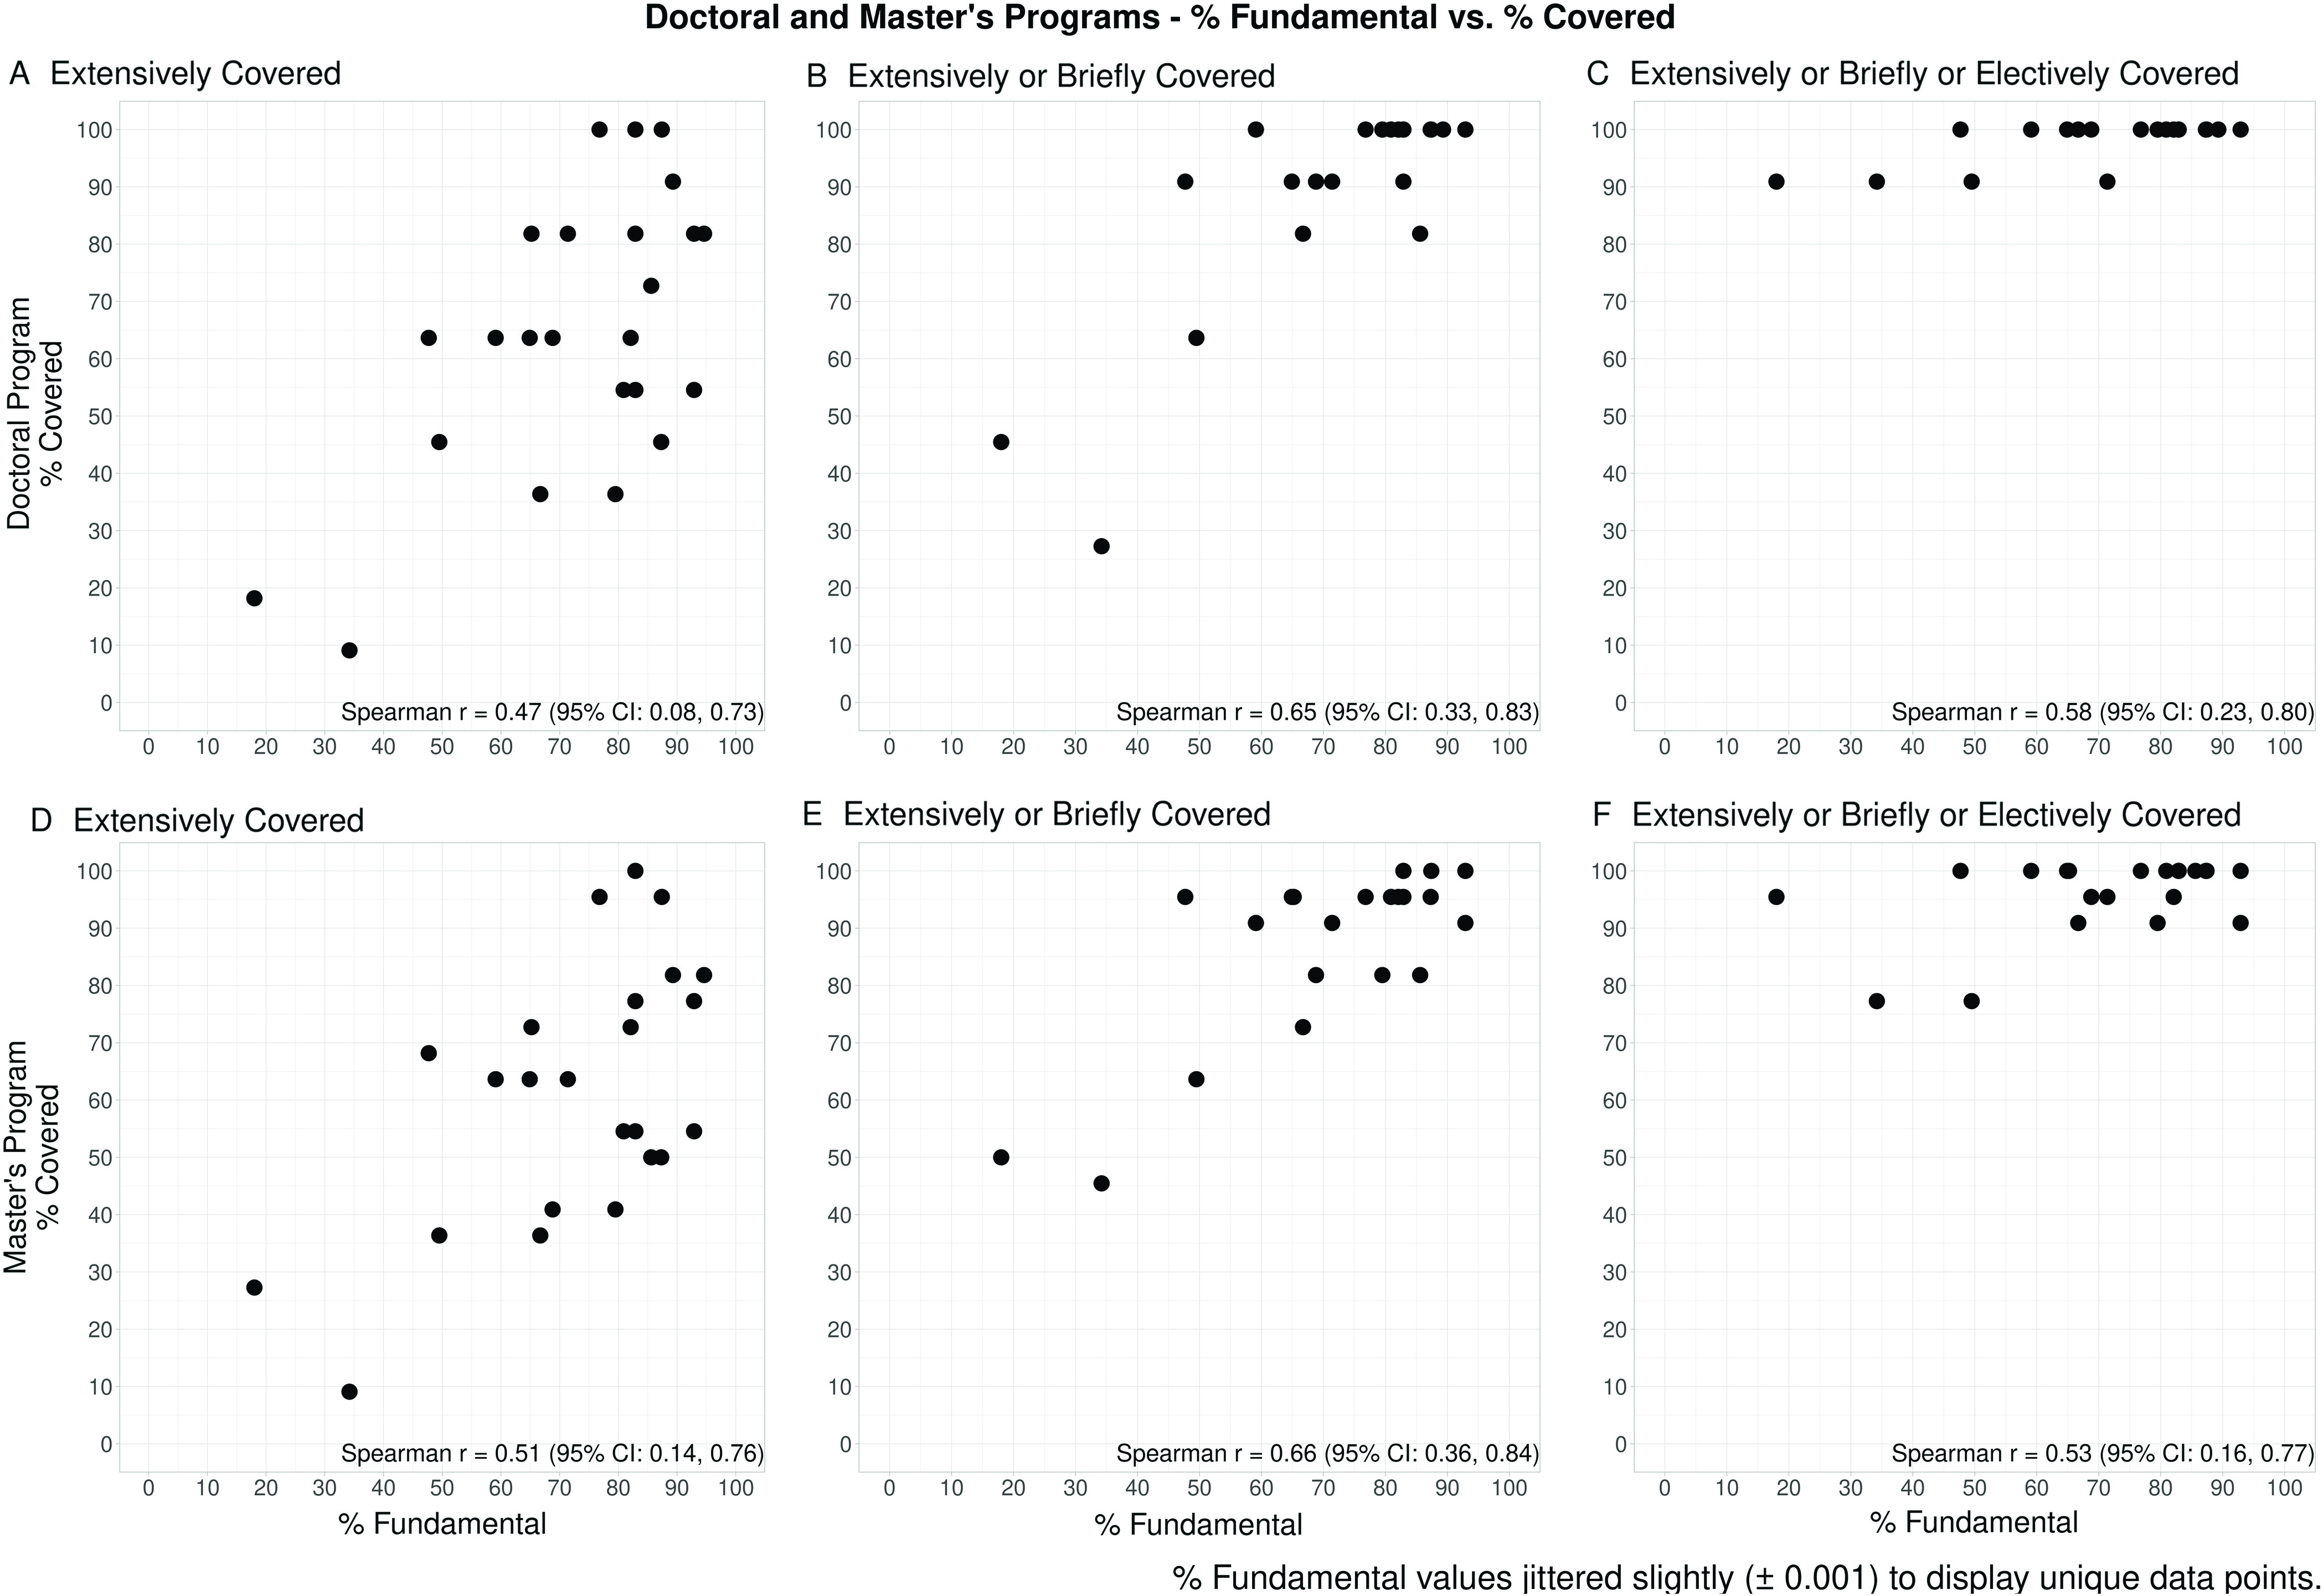
Fig. 2.

Relationship between the percent each of the 24 statistical competencies are covered in CTSA programs versus the percent fundamental. The percentage of CTSA programs that cover each competency (1) extensively in required coursework (left two panels), (2) extensively OR briefly in required coursework (middle two panels), or (3) extensively OR briefly in required coursework OR in elective coursework only (right two panels) is plotted versus the extent to which a competency was perceived as fundamental in prior work [4], separately for doctoral (top three panels: n = 11 CTSA programs) and master’s programs (bottom three panels: n = 22 CTSA programs). The 24 statistical competencies are represented by a dot in each graph. Spearman correlation coefficients and 95% confidence intervals are included on each plot.
