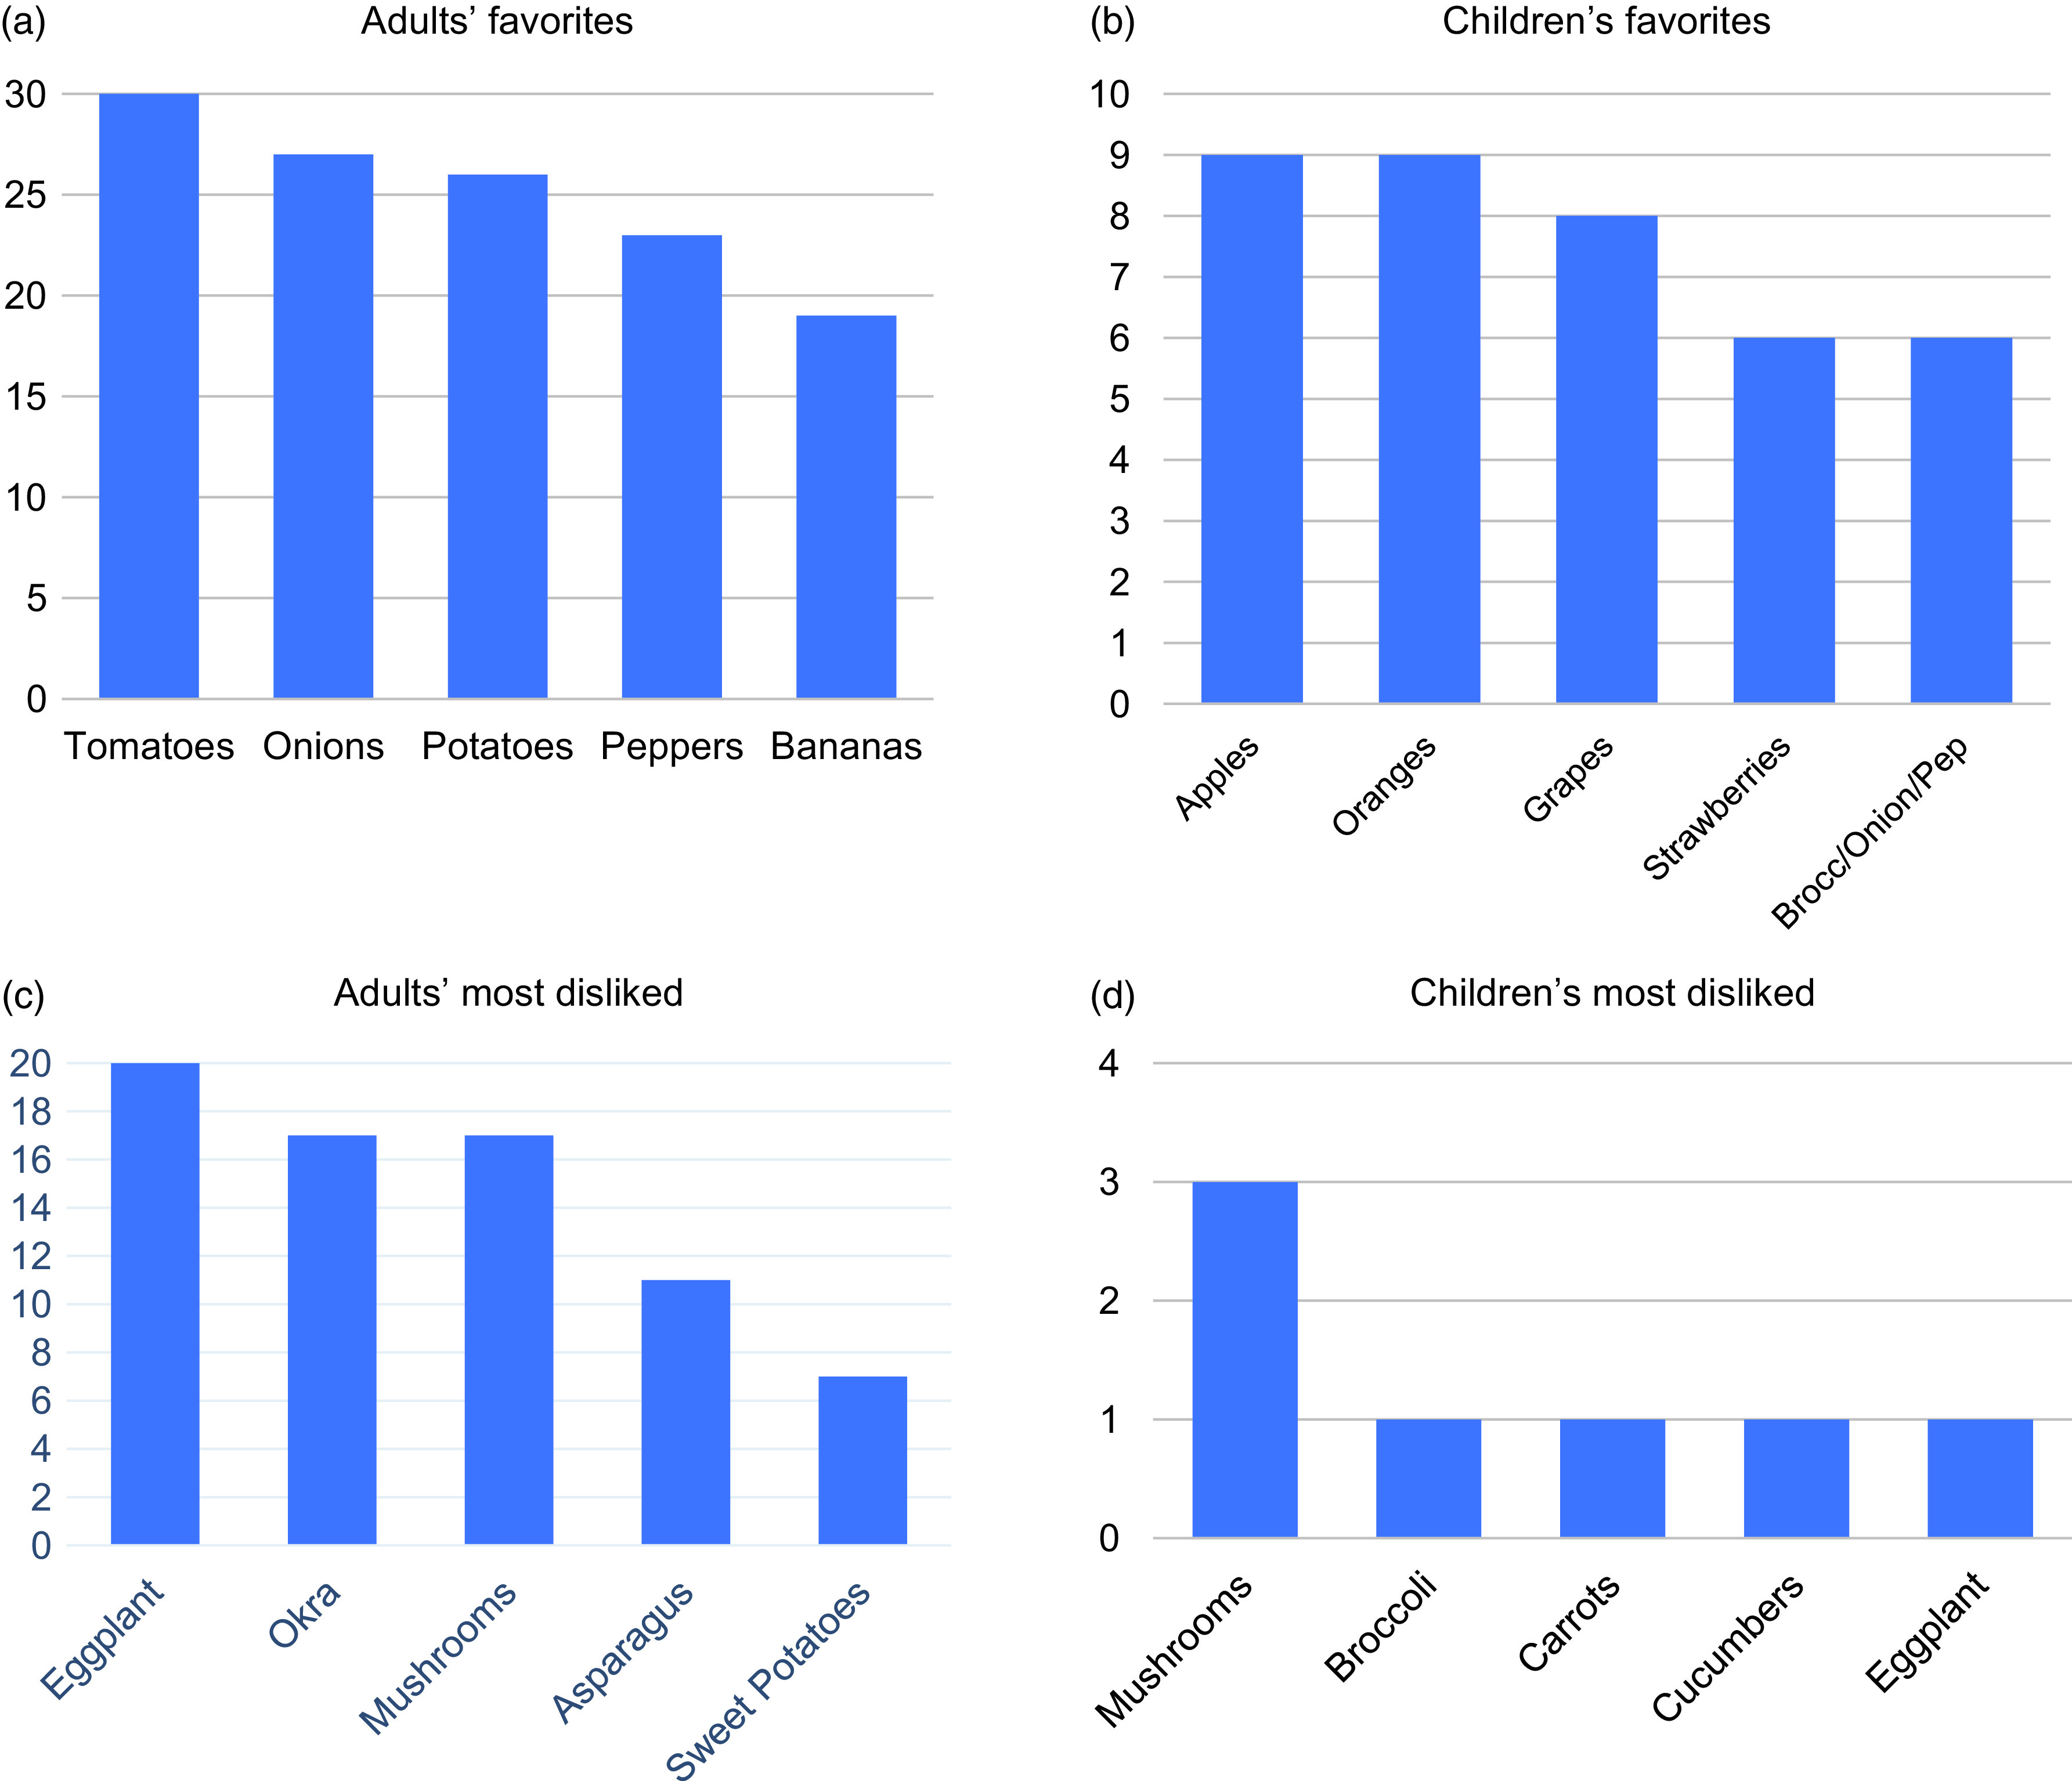
Fig. 3.

Most and least liked fresh produce preferences of participants interviewed. (N, number of respondents on y-axis, produce on x-axis). Answers stratified into adult and child preferences. Children’s preferences are primarily reported by adults. Note: Fig. 3(b) shows broccoli/onion/peppers as all preferred the same amount, consolidated in one bar.
