Fig. 3.

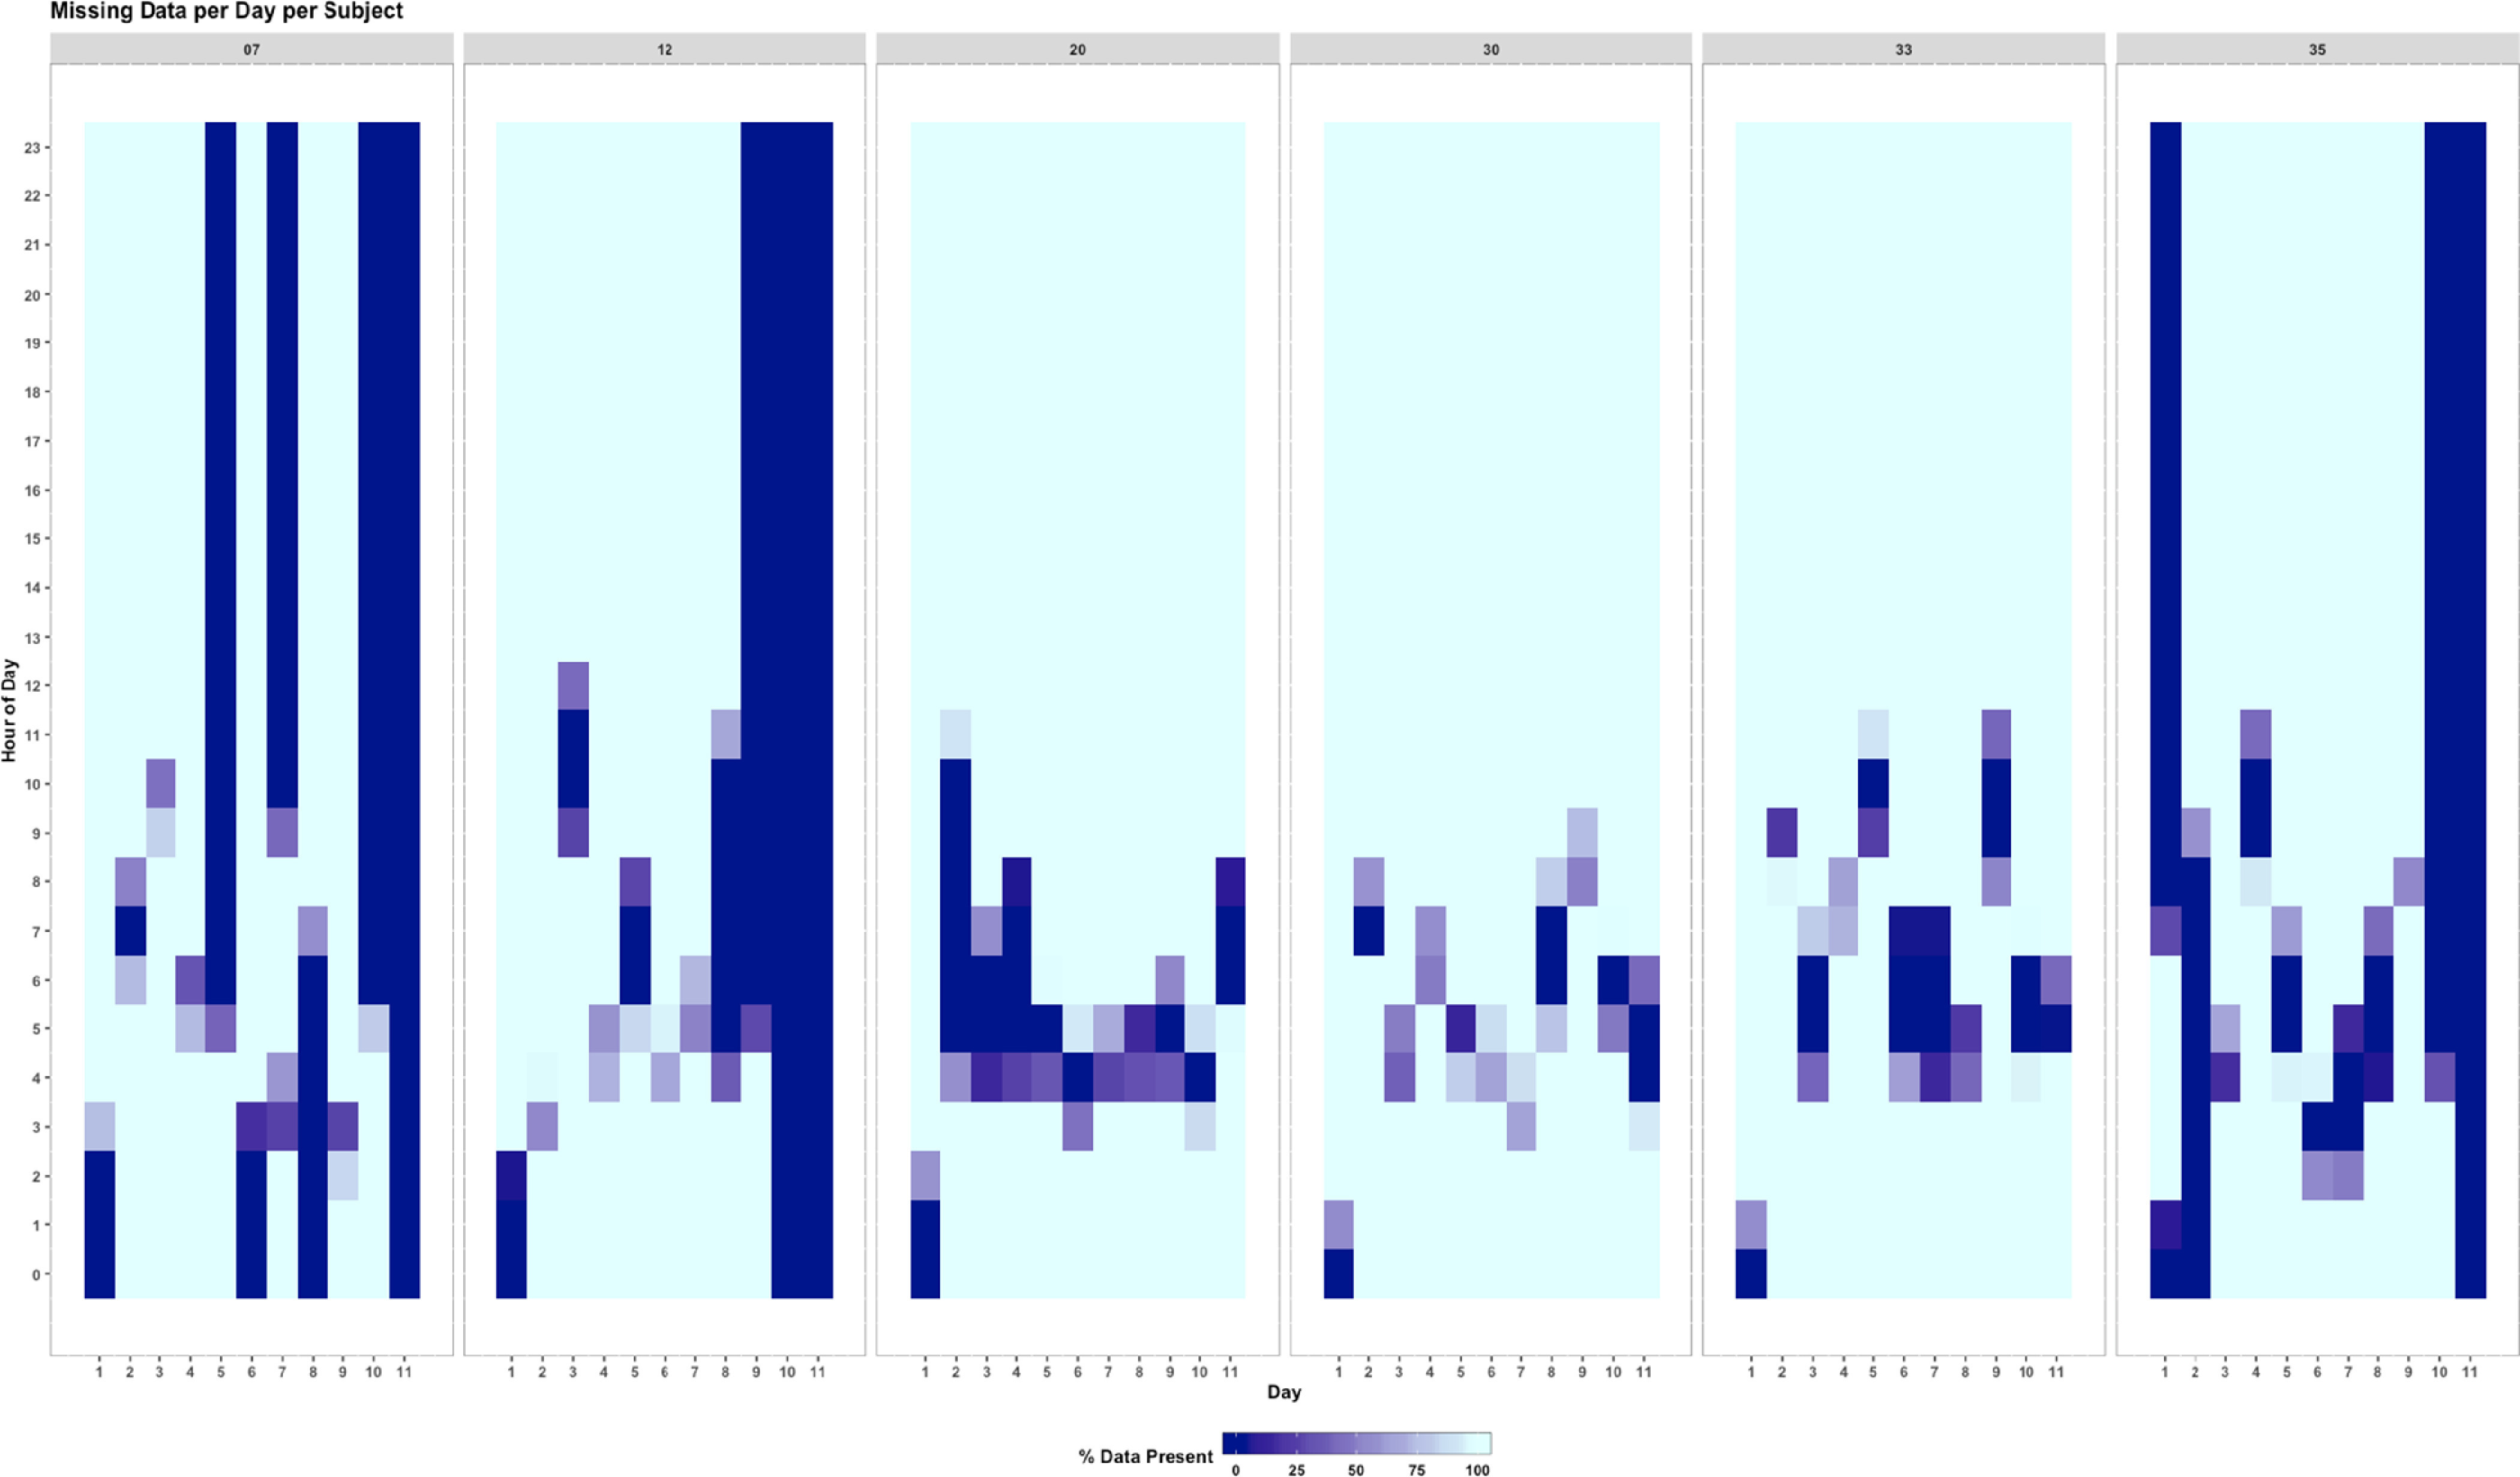
Missing data visualization available in the DBDP EDA module. This figure shows the percent of wearable data present per day and per hour for six study participants during a 10-day influenza exposure study [25].

Missing data visualization available in the DBDP EDA module. This figure shows the percent of wearable data present per day and per hour for six study participants during a 10-day influenza exposure study [25].