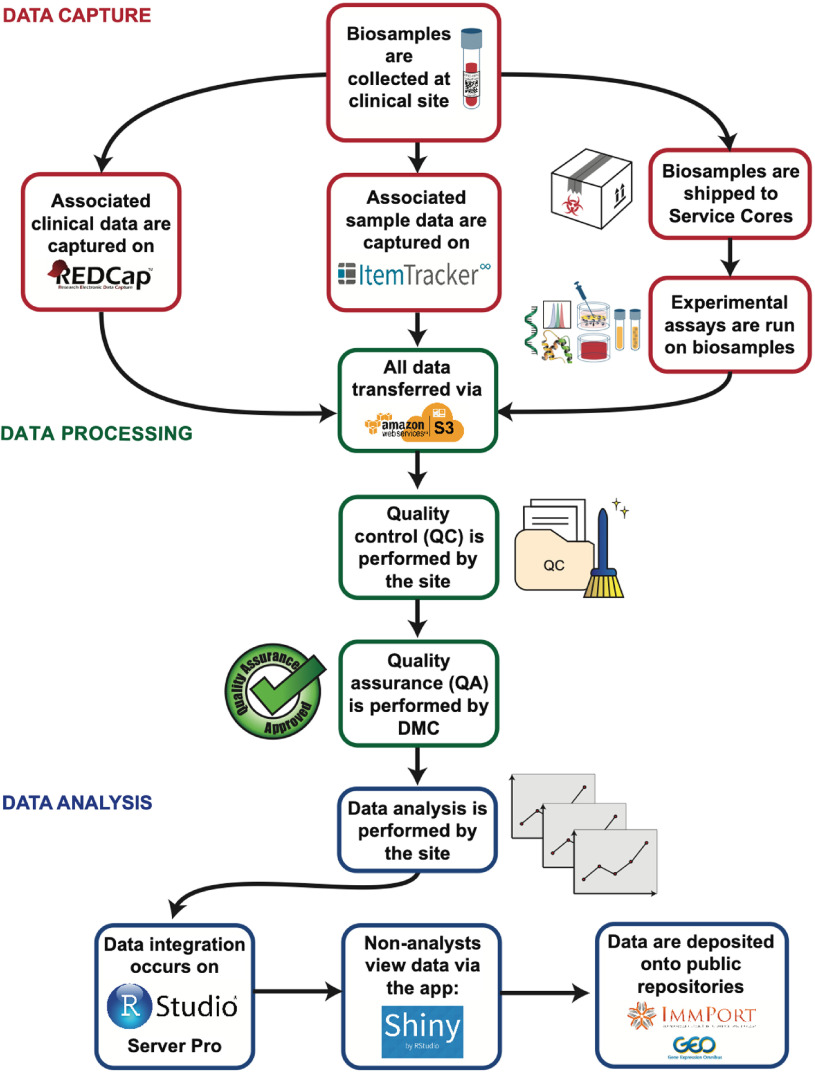
Fig. 2.
Overall data pipeline for the project. Clinical and sample data are generated and captured at the clinical site. Experimental assays are run in multiple Service Cores. Each of these sites and cores performs quality control (QC) as well as independent data analysis. All data transfers occur via S3. The DMC then performs quality assurance (QA) and uploads the clean data to S3. Data are integrated on RStudio Server Pro and accessed on R Shiny application. Following publication of study output, data are deposited onto public repositories, such as ImmPort and Gene Expression Omnibus. Note: This illustration does not necessarily depict chronological timelines as the data flow is often run in multiple batches.

