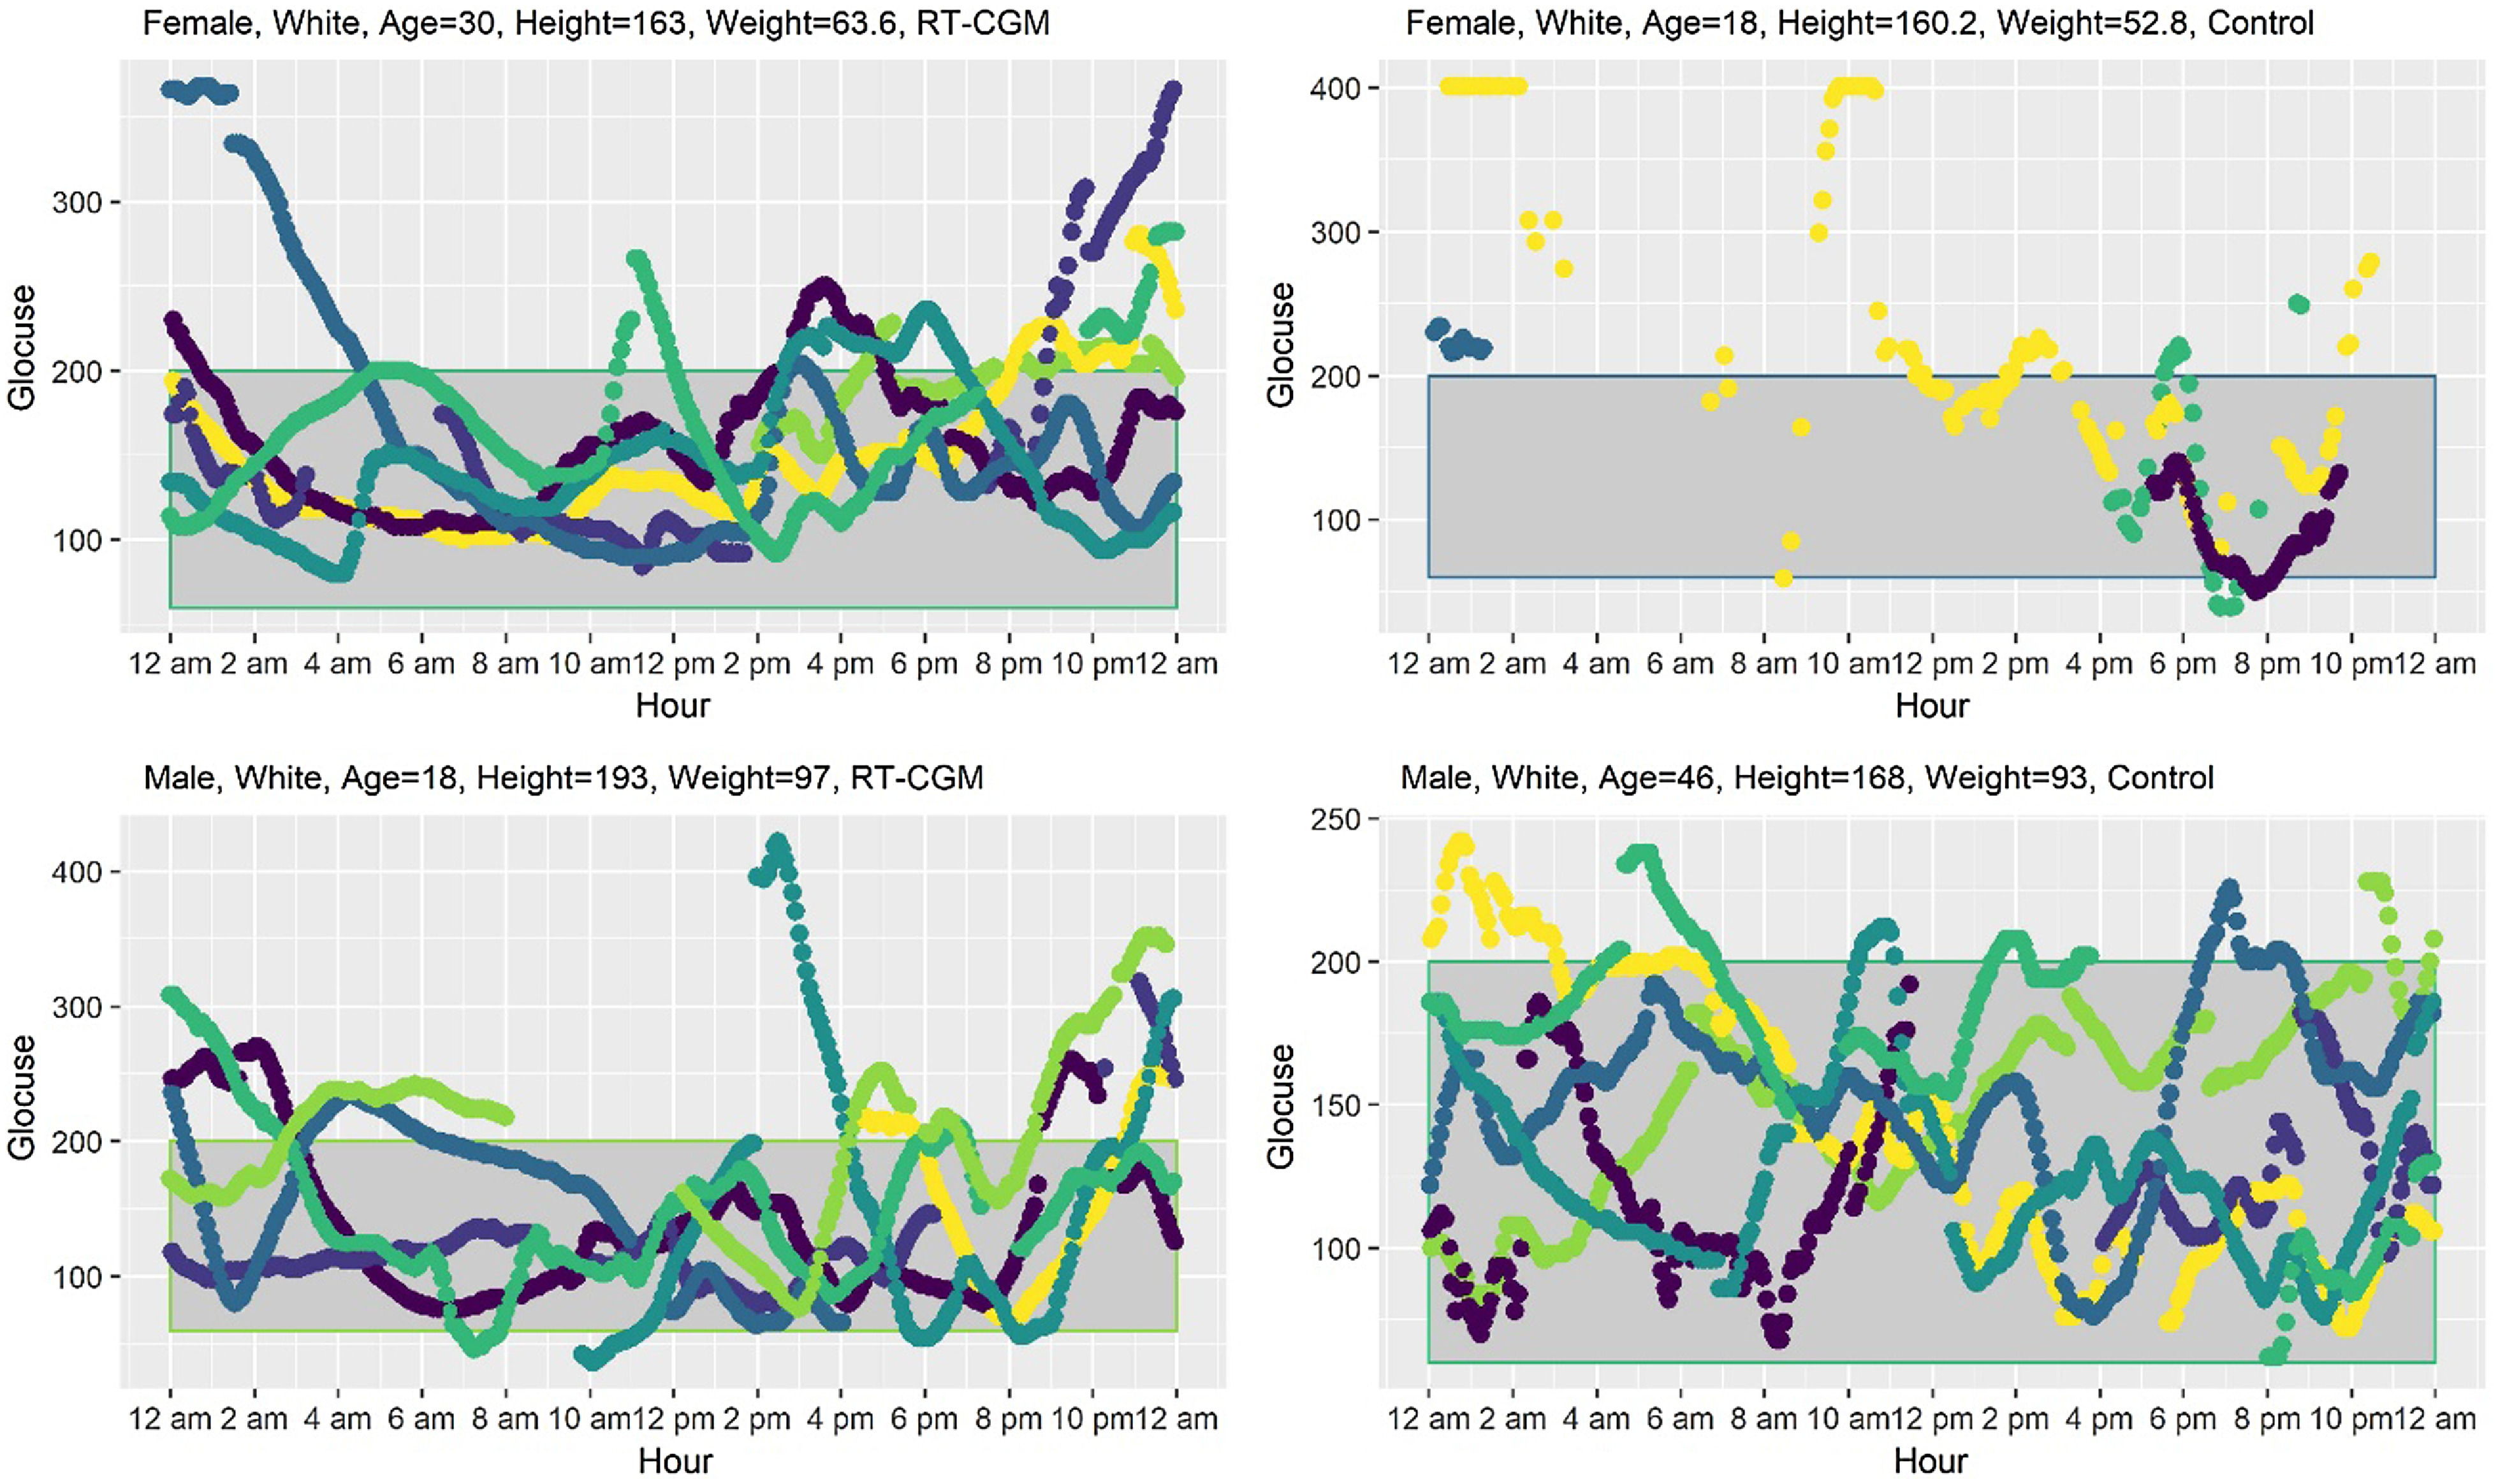
Fig. 1.

CGM sensor tracings of four representative (first row – females; second row – males) patients aged 18–46 from type 1 diabetes analysis cohort with glucose readings (y-axis, in mg/dL) against clock time (x-axis). Respective demographic/clinical characteristics are on headers. Data points are colored according to observed day of week. RT-CGM, real-time continuous glucose monitoring.
