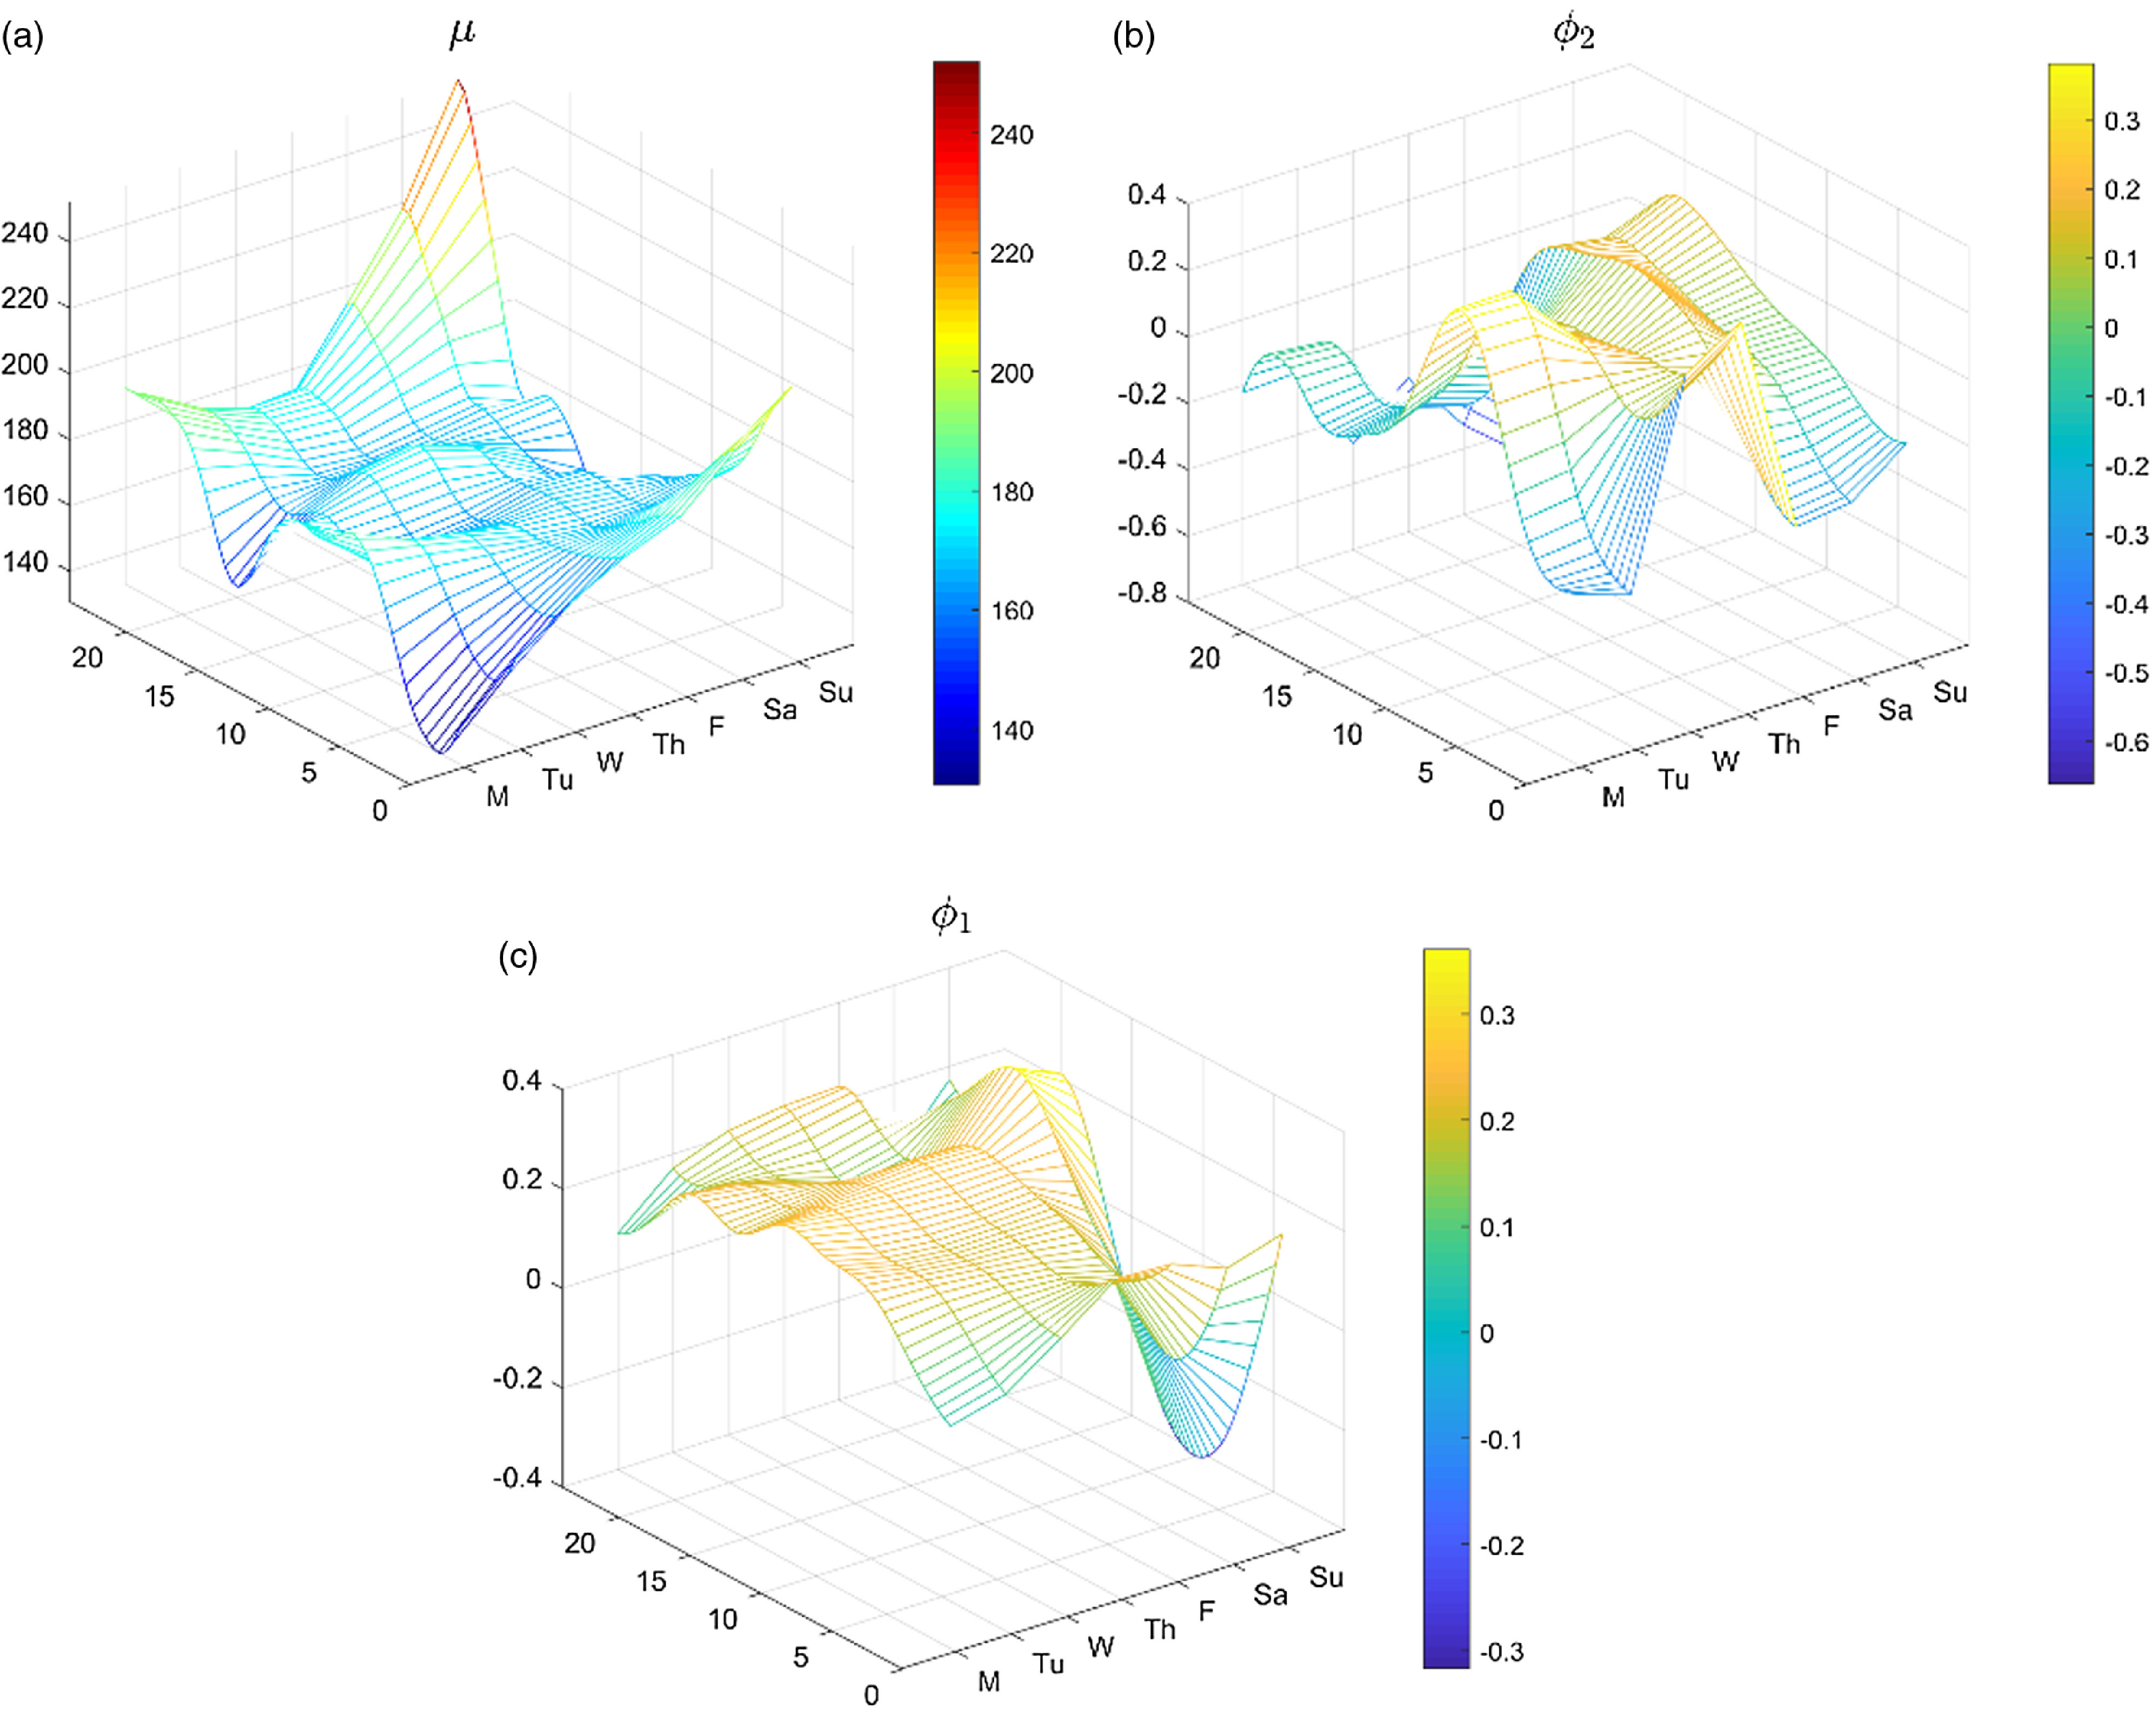
Fig. 3.

Two-stage functional principal components analysis for sparse longitudinal data (FPCA) shows poorer glycemic control at nighttime and on weekends (three-dimensional manifold plots of FPCA on the CGM cohort). In each plot, the hour of CGM (0–24 h represents 12–12 am) is on the lower left axis; day of week is on the lower right axis; magnitude is on the upper axis. The vertical axes represent (A) glucose level (mg/dL); (B–C) degree of oscillatory variability in the first and second FPCs, respectively, which are unitless quantities. The vertical heatmap bars depict values ranging from lower magnitudes (blue) to higher magnitudes (red). (A) Smoothed CGM tracings for 10 representative patients, (B) the first harmonic, and (C) the second harmonic.
