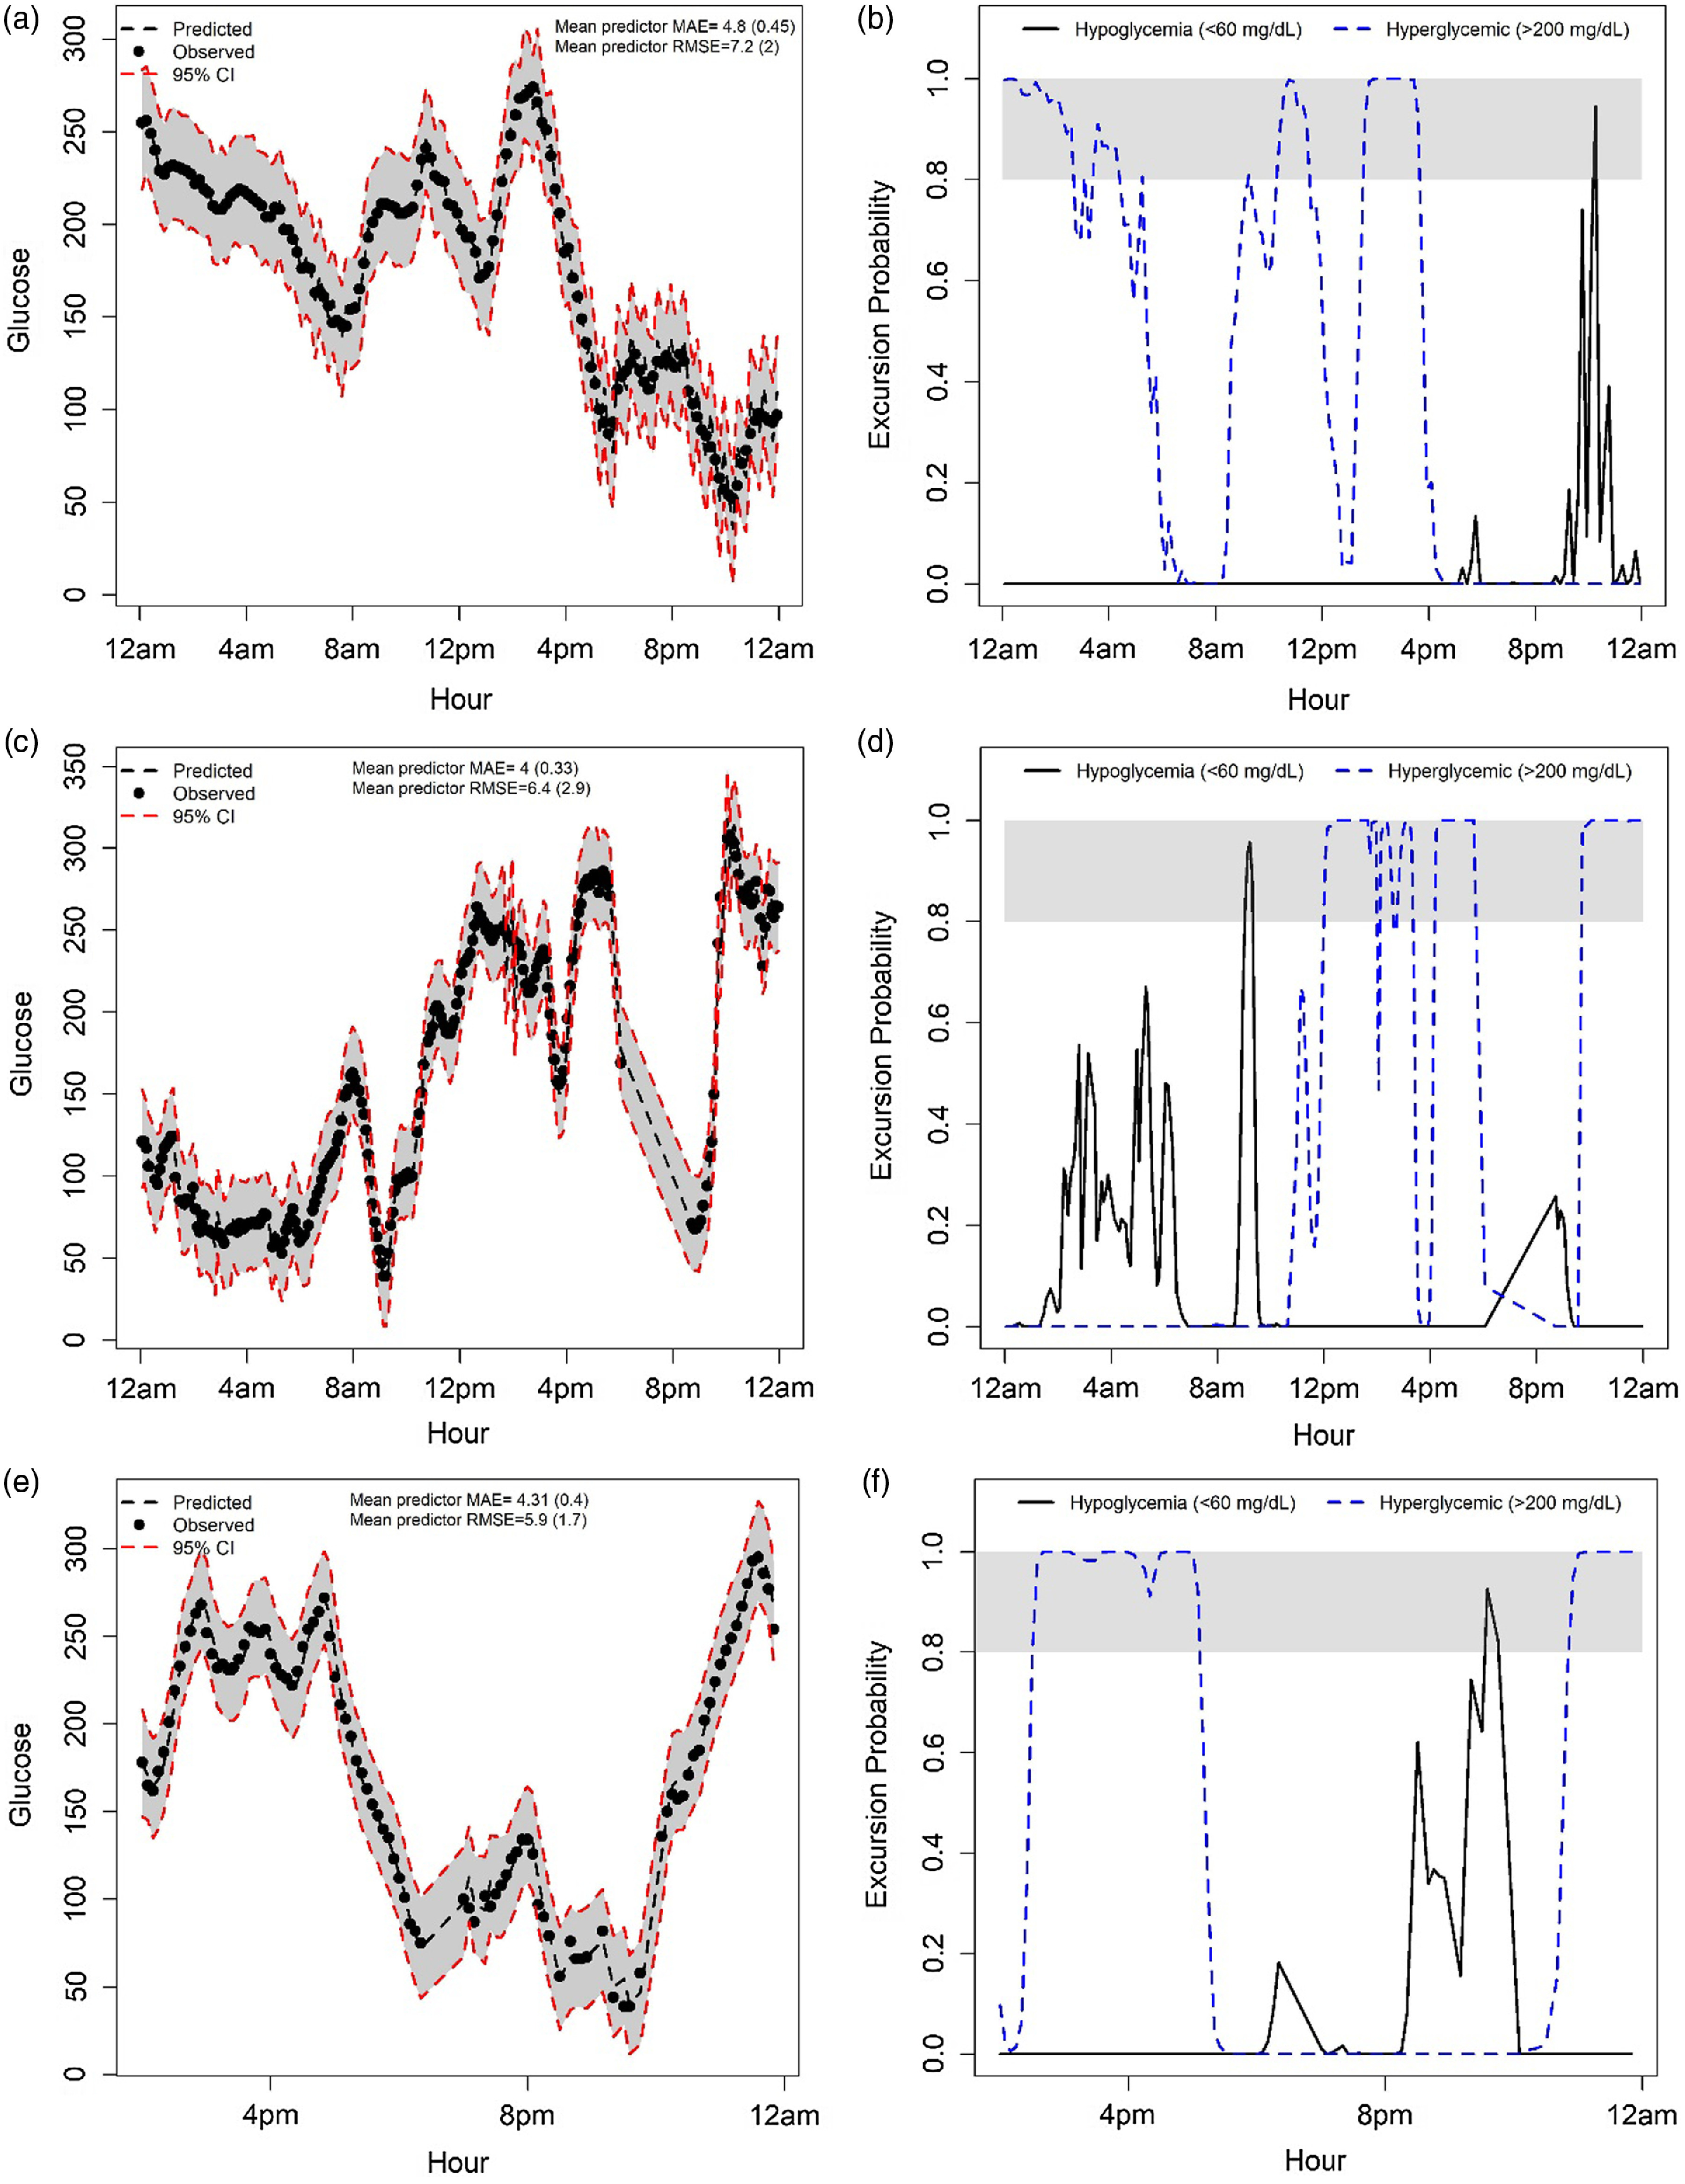
Fig. 4.

Observed glucose tracings and model fit/prediction for three different study subjects (one per row). The first row is for a 62-year-old White female from the control group; height: 160 cm; weight: 68 kg. The second row is for a 8-year-old White female from the control group; height: 140 cm; weight: 32.8 kg. The third row is for a 41-year-old White male from the RT-CGM group; height: 168 cm; weight: 79 kg. Left panel: Observed glucose readings (y-axis) from CGM (black dots) over clock time (x-axis) are shown with FD prediction (dashed line) and 95% CI (gray band with red dashed lines); Right panel: real-time risk for glycemic excursions (black line is the probability of hypoglycemia; blue line is the probability of hyperglycemic: gray band is the area where probabilities ≥ 0.80 or 80%).
