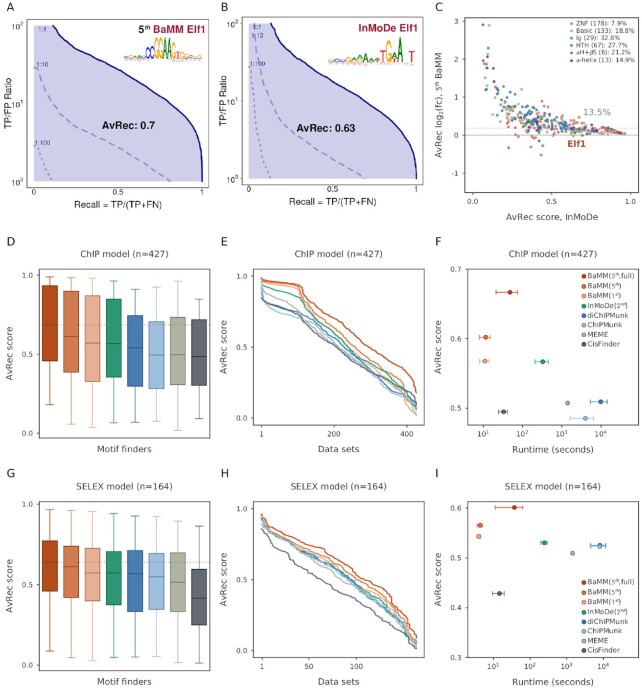
Figure 2.
Performance of de novo motif discovery tools on in vivo and in vitro datasets. (A) AvRec analysis for fifth-order BaMM on the Elf1 ENCODE dataset. The AvRec is the recall averaged in log space over TP-to-FP ratios between 100 and 102. This ratio range corresponds to a precision between 1/(1 + 1) and 100/(1 + 100) = 0.99. Bold line: 1:1 ratio of positives to negatives. At 1:10 ratio (dashed) and 1:100 (dotted), the curves are shifted down by a factor of 10 and 100, respectively. Inset: motif logo of Elf1. (B) Same as (A) for the InMoDe model of Elf1. (C) log2 of AvRec fold change between fifth-order BaMMmotif2 and InMoDe models versus the AvRec of InMoDe. Each dot represents one dataset. Elf1 is highlighted in a brown triangle. Dot colors represent different TF superfamilies defined by (40). ZNF: Zinc-finger DNA-binding domains, Basic: Basic domains, Ig: Immunoglobulin fold, HTH: Helix-turn-helix domains, αH+βS: alpha-helices exposed by beta-structures, αH: Other all-alpha-helical DNA-binding domains. The median AvRec fold change and the number of motifs are shown in the legend. The overall median log2 fold change is 13.5%. (D) AvRec distributions as box plot, with boxes indicating 25%/75% quantiles and whiskers 95%/5% quantiles. Color code: see the legend in (F). (E) Cumulative distribution of AvRec scores on the 427 datasets. (F) Average runtime per dataset on four cores versus the median AvRec score. InMoDe and (di)ChIPMunk are not parallelized and ran on a single core. Whiskers: ±1 standard deviation. BaMM (5th, full): no masking step. (G–I) Analogous to (D–F) but for 164 HT-SELEX datasets from the Taipale lab (39).

