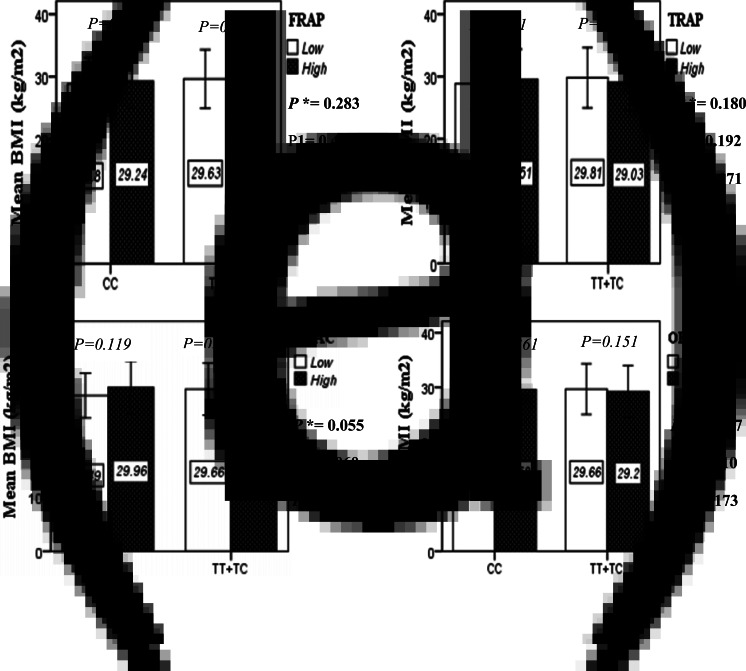
Fig. 1A.
Interaction between the APOA2 polymorphism and the dietary TAC: FRAP (a), TRAP (b), TEAC (c), and ORAC (d) intake with regard to BMI. According to the median dietary TAC the participants were dichotomized into “high” and “low” categories (≤, > of median), FRAP (≤15.94, 15.95 > mmol Fe2+/d); TRAP (≤8.25, 8.26 > mmol TE/d); TEAC (≤7.46, 7.47> mmol TE/d); ORAC (≤27296.21, 27296.22> μmol TE/d). P*; crude, P1; model 1, and P2; model 2. P*-values for the interaction terms between dietary TAC intake (as dichotomous) and the APOA2 polymorphism were obtained with General Linear Model (Two-Way ANOVA). The P1 value of the interaction (Model 1) is adjusted for supplement use (as categorical), smoking (as categorical), and total energy intake (as continuous). In model 2, in addition to the variables of model 1, it was also adjusted based on the variables of age (as continuous) and sex (as categorical) using the ANCOVA test. In the stratified analysis by APOA2 genotypes, P-values for mean comparisons of BMI between two categories of antioxidant intake were estimated by Independent Samples t-test. Bars indicate mean ± SD.

