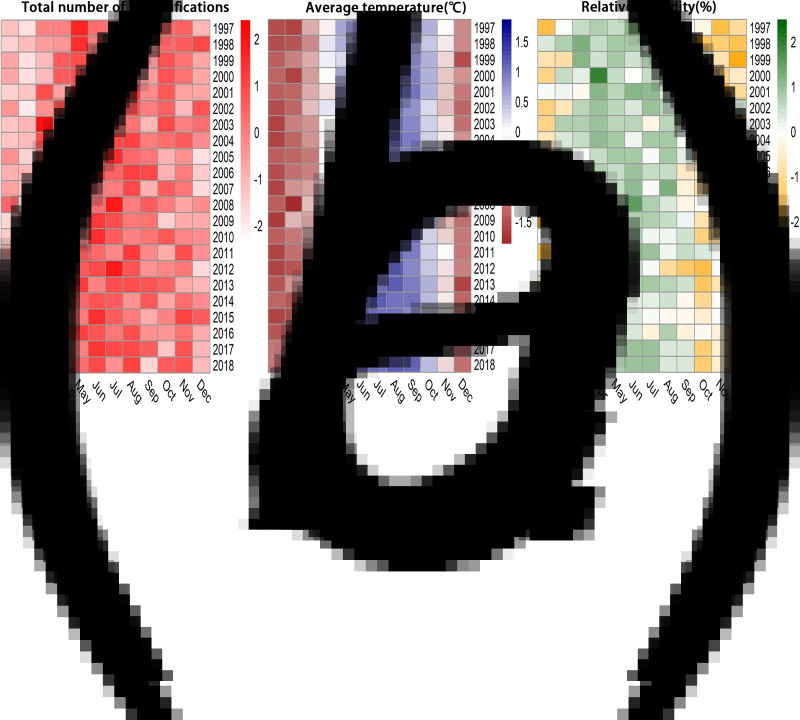
Fig. 1.
Annual cycle of the total number of TB notifications, average temperature and relative humidity in Hong Kong from 1997 to 2018. Annual cycle of (A) monthly total number of TB notifications; (B) monthly average temperature (°C) averaged over all the weather stations, and (C) monthly relative humidity (%) averaged over all the weather station.

