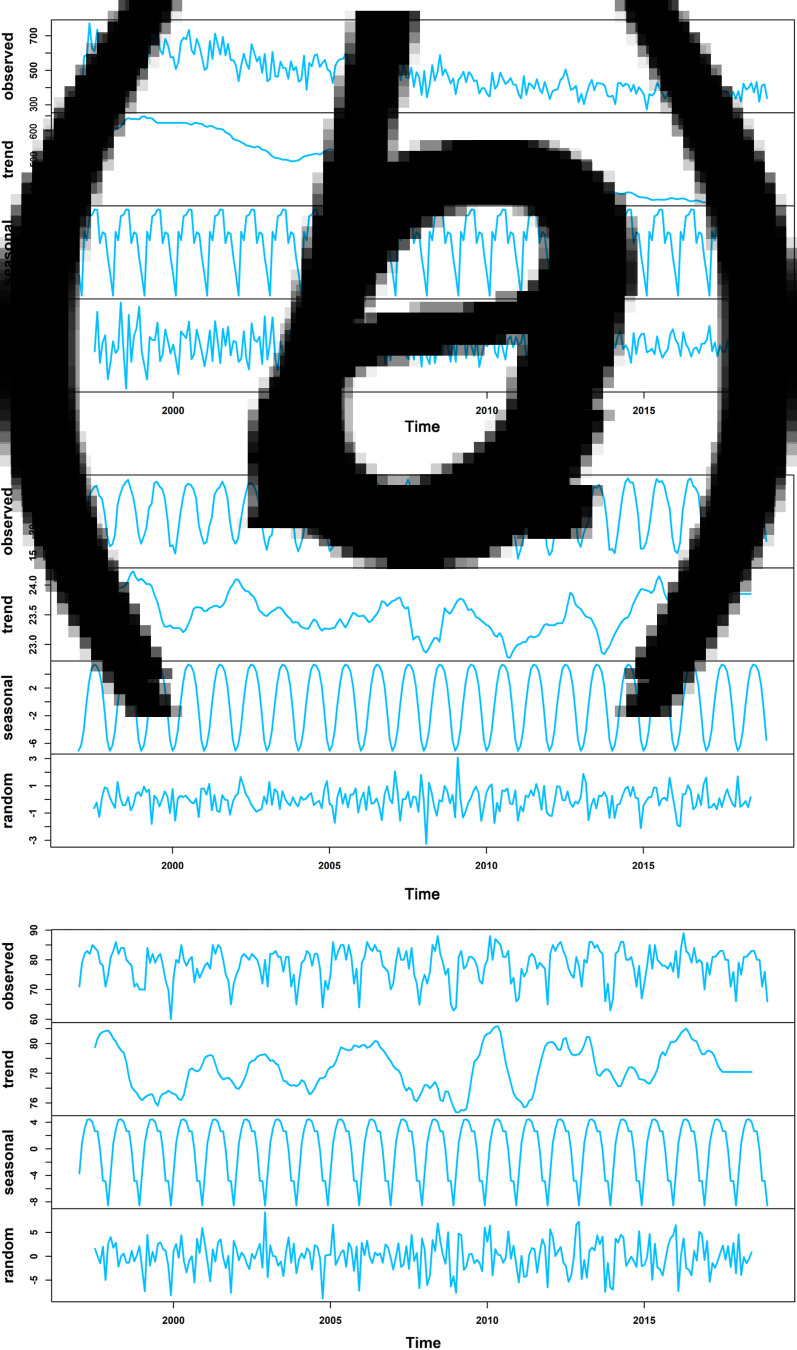
Fig. 2.
Decomposition plots of the time-series in Hong Kong from 1997 to 2018. The decomposition plot of (A) monthly total number of TB notifications; (B) monthly average temperature, and (C) monthly relative humidity. The top layer shows the original time-series observed. The other layers show the decomposed components, denoting the seasonal component, long term trend component, and remainder component, respectively.

