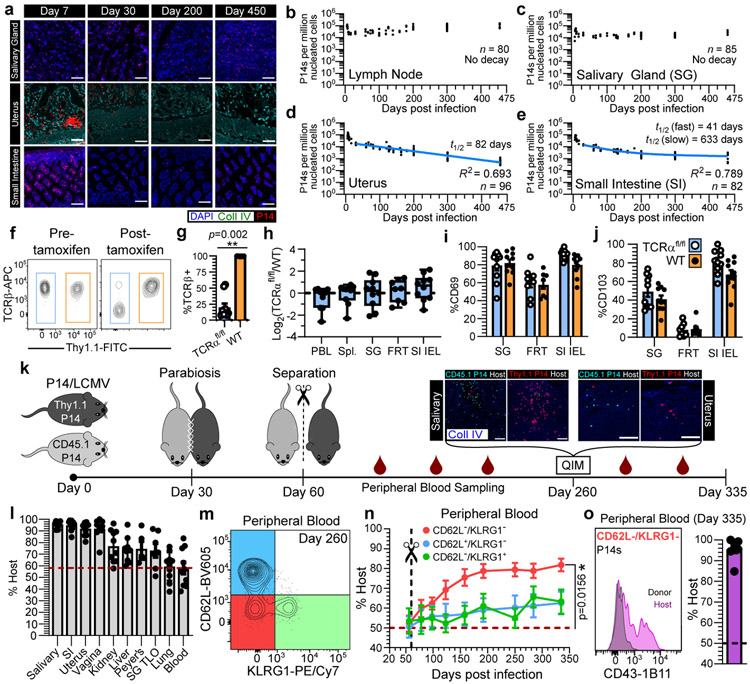
Fig. 1. Residence sustains organism-wide autonomous T cell immune surveillance.
a-e, Using quantitative immunofluorescent microscopy (QIM) (a), P14 memory CD8+ T cells were enumerated five to 450 days after LCMV infection in n = 80-96 biologically independent mice from six independent experiments (b-e). f-j, Secondary LCMV-specific TCRαfl/fl and WT memory T cells were established (see methods and Extended Data Fig. 2a) and mice were treated with tamoxifen to selectively ablate TCR, as evaluated 12 days post-treatment (f, g). To assess the impact of TCR ablation on T cell survival, the ratio of TCRαfl/fl/WT CD8+ T cells was quantified 60 days after tamoxifen and normalized to pre-tamoxifen values from blood (h). Expression of residence markers was compared between WT and TCRβ− TCRαfl/fl TRM (i, j). Data pooled from four independent experiments for a total of n = 10 mice, except FRT, n = 8 mice (g-j). k-o, Congenically distinct parabiotic P14 chimeras were surgically separated (k) and 260 days after LCMV, n = 5-10 mice (n varies by tissue) were examined by QIM to evaluate durability of residence among extravascular P14 memory CD8+ T cells (l). After separation, peripheral blood of n = 7 parabiotic P14 chimera mice was serially monitored for reemergence of disequilibrium among P14 memory CD8+ T cells, which were subdivided based on CD62L/KLRG1 expression (m, n) and 335 days after LCMV, CD62L−/KLRG1− donor and host P14 memory CD8+ T cells were evaluated for CD43-1B11 (o). Coll IV, collagen type IV. FRT, female reproductive tract. IEL, intestinal epithelial lymphocytes. TLO, tertiary lymphoid organ. 100 μm scale bars (a, k). Statistical significance was determined by two-tailed Wilcoxon matched-pairs signed rank test (g, i, j) and two-tailed one sample Wilcoxon test using 0 (h) or 50% (n) as a hypothetical mean. Data are presented as mean values +/− SEM or box plots showing median, IQR, and extrema.

