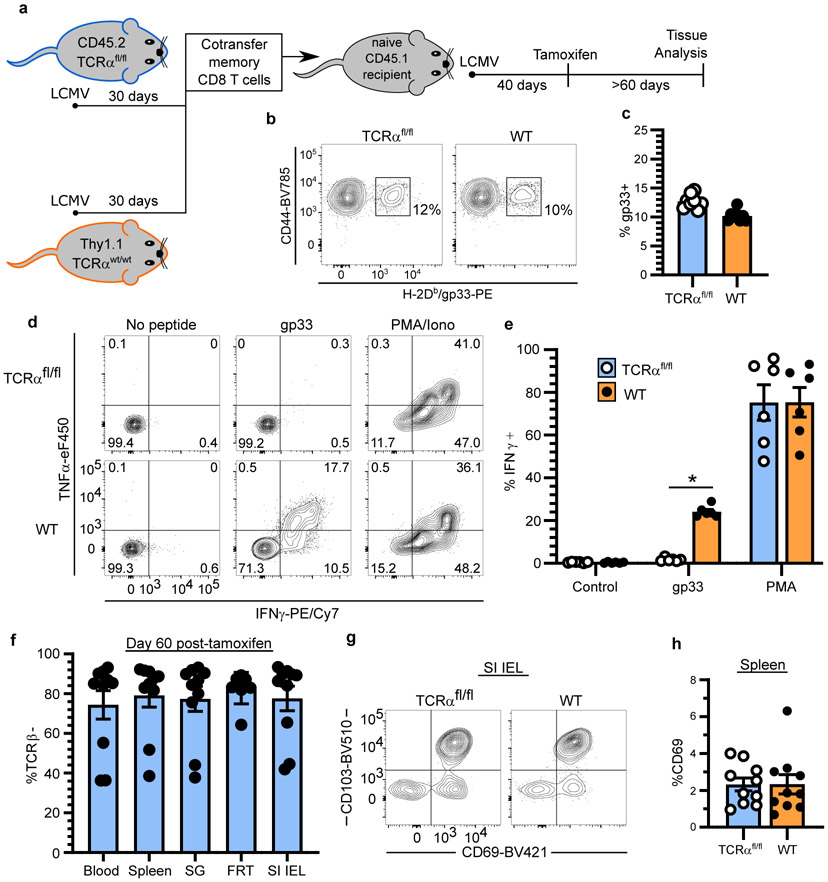
Extended Data Fig. 2. Selective TCR ablation using TCRαfl/fl mice reveals TCR-independent homeostasis of TRM.
a, Experimental model. Thy1.1−/CD45.2+ UBC-CreERT2 TCRαfl/fl mice (TCRαfl/fl mice, for brevity) and Thy1.1+/CD45.2+ WT B6 mice were infected with LCMV. After 30 days, 107 lymphocytes, isolated from secondary lymphoid organs, were transferred into naive CD45.1+ B6 mice which were subsequently infected with LCMV. 40 days after infection, CD45.1+ mice were treated with tamoxifen to selectively ablate TCR from transferred Thy1.1−/CD45.2+ TCRαfl/fl secondary memory T cells. b, c, LCMV-specific secondary memory T cells in peripheral blood are shown 40 days after LCMV infection (prior to tamoxifen treatment). Data pooled from three independent experiments for a total of n = 8 mice (c). d, e, Selective TCR ablation of TCRαfl/fl secondary memory CD8+ T cells as measured by ex vivo peptide stimulation assay. 60 days after tamoxifen treatment of CD45.1+ B6 recipients, splenocytes were isolated and stimulated in vitro with gp33-41 peptide. Cytokine production by TCR− TCRαfl/fl memory CD8+ T cells and TCR+ WT memory CD8+ T cells from spleen is shown and reflects n = 6 mice (d, e). f, The frequency of cells that lack TCRβ expression on TCRαfl/fl memory CD8+ T cells is shown. Data pooled from four independent experiments for a total of n = 8-10 mice (n varies by tissue) (f). g, Representative flow cytometry depicts expression of tissue-resident markers on small intestine epithelial (SI IEL) memory CD8+ T cells 60 days after tamoxifen treatment. h, The frequency of CD69+ memory CD8+ T cells in the spleen is shown for WT and TCRβ− TCRαfl/fl populations. Data pooled from four independent experiments for a total of n = 8-10 mice (n varies by tissue) (h). Statistical significance was determined by two-tailed Wilcoxon matched-pairs signed rank test (e, h), where *p = 0.0313. Data are presented as mean values +/− SEM.

