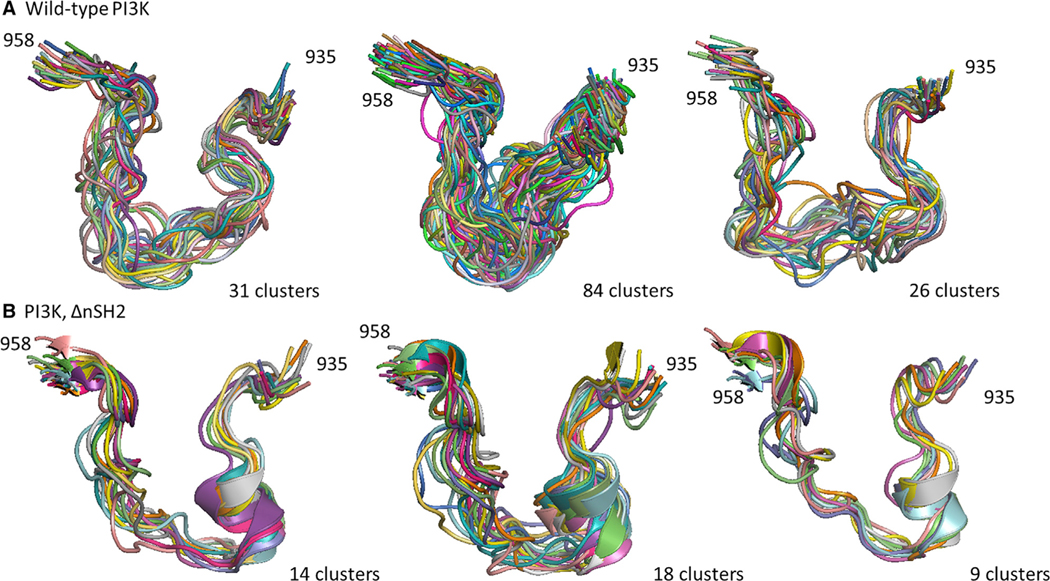
Figure 5. Clustering Analysis of Activation-Loop Conformations in PI3Kα.
Molecular simulation data from the WT PI3Kα system (A, three replicates) and the system in which the nSH2 domain is absent (B, three replicates) were clustered using the Gromos algorithm. The conformations of the activation loop (residues 935–958) were clustered with a cutoff of 2.5 Å.

