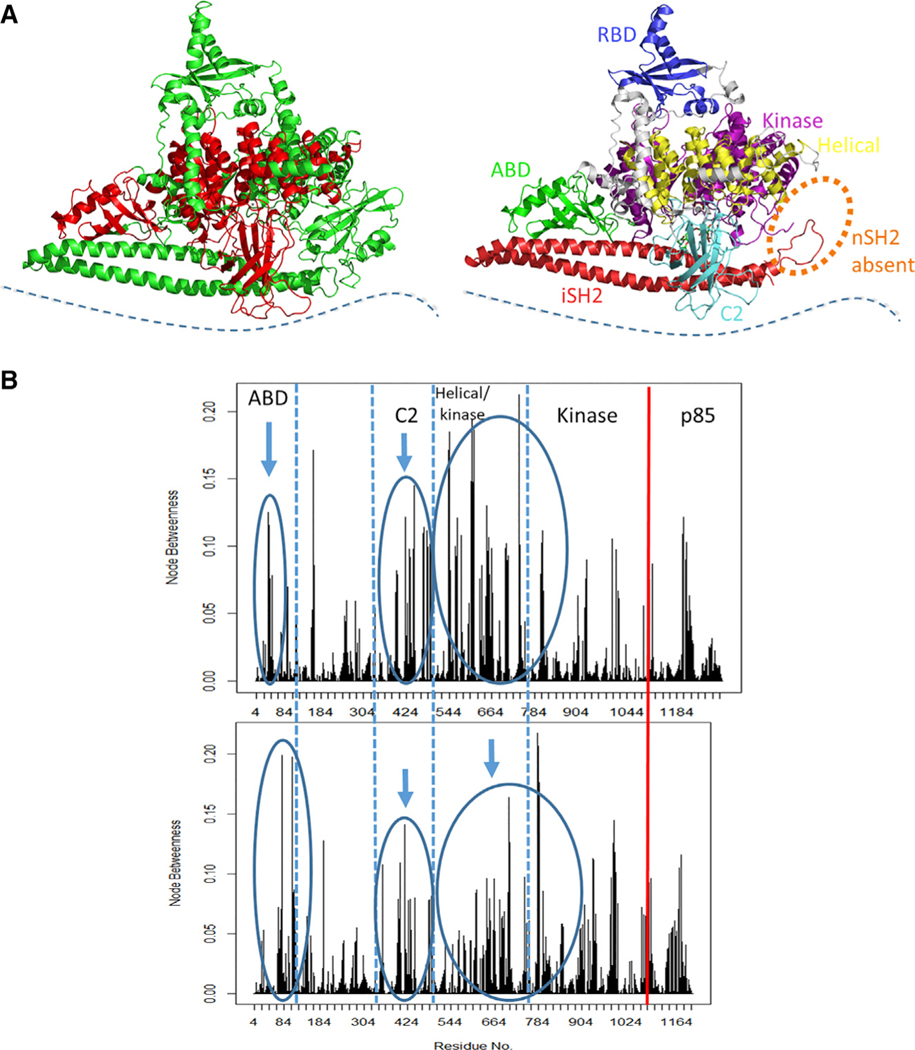
Figure 6. Normalized Node Betweenness Comparison of PI3Kα Systems.
(A) Structural representation of domains (in red) exhibiting altered node betweenness. The location of the cell membrane is indicated by the blue dotted line.
(B) The node betweenness profile is shown for a replicate of WT PI3Kα (top) and of the PI3Kα ΔnSH2. The vertical red line indicates the end of the p110α domain.

