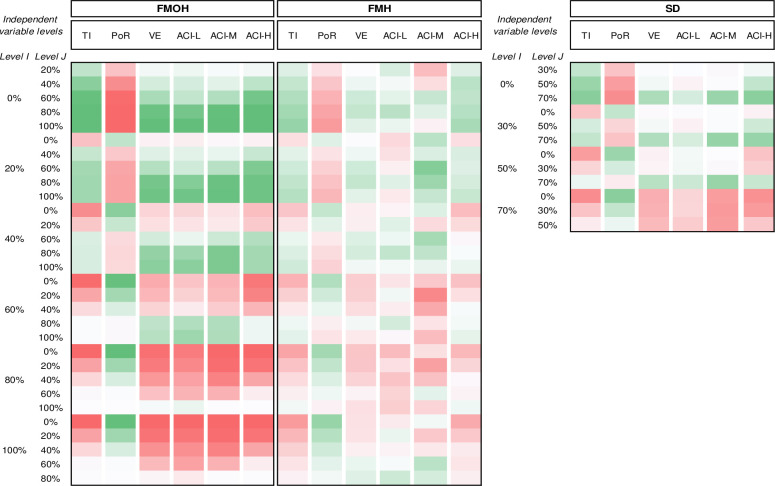
Fig 1.
The mean difference (I-J) between different control strategy levels obtained by two-way MANOVA dark green is the maximum and dark red implies minimum; Percentage of Reduction (POR); Total Infections (TI); Virus Elimination (VE); Active Cases Intensity–Low (ACI-L); Active Cases Intensity–Medium (ACI-M); Active Cases Intensity–High (ACI-H).

