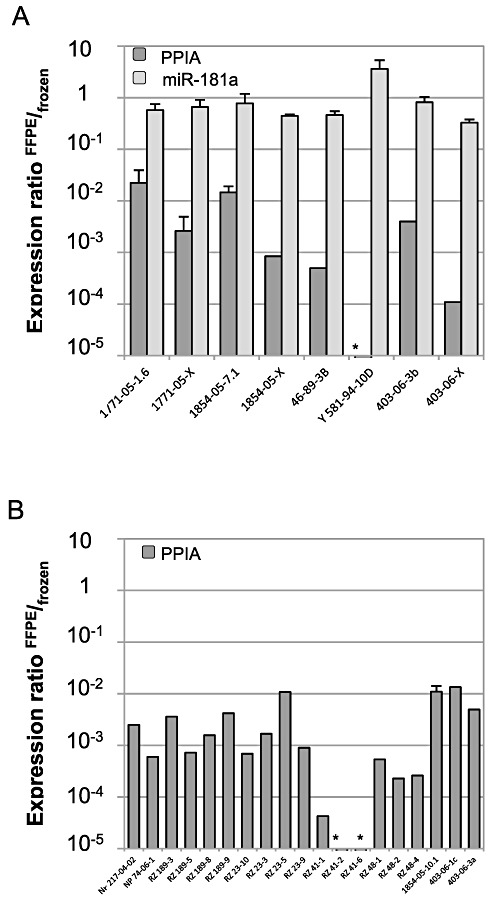
Figure 1.

Amplification of peptidyl‐prolyl‐isomerase A (PPIA) and miR‐181a in randomly selected archival multiple sclerosis (MS) tissue samples. A. Amplification of PPIA (dark gray columns) and miR‐181a (light gray columns) was analyzed in eight formalin‐fixed and paraffin‐embedded (FFPE) specimens of five MS patients. Amplification in each FFPE specimen was compared with mean amplification in six frozen specimens (standard error of the mean < 2%). The expression ratio FFPE/frozen was calculated as 2−ΔCt with ΔCt = Ct (individual FFPE specimen) − mean Ct (n = 6 frozen). An expression ratio of 1 indicates comparable amplification in FFPE compared with frozen tissue. B. Similarly, PPIA was analyzed in 19 additional FFPE specimens of eight MS patients (dark gray columns). PPIA was not detected in samples marked with *. Error bars represent standard deviation for technical duplicates.
