
Figure 3.
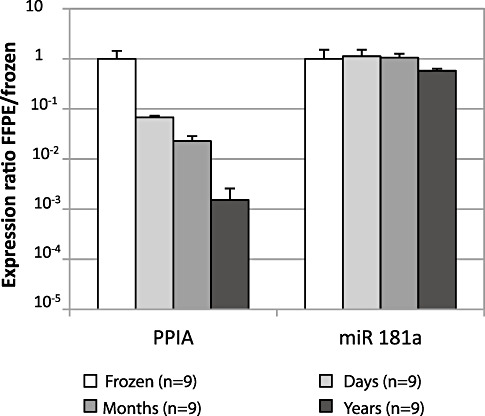
Effect of formalin fixation on amplification of PPIA and miR‐181a. Thirty FFPE samples were grouped according to three time periods of fixation in 4% PFA: “days”: (n = 9, formalin fixed for 2–21 days), “months” (n = 9, formalin fixed for 2–4 months), “years” (n = 3, formalin fixed for 2–3 years) and transcript amplification was compared with “frozen” specimens of the same donors (n = 9). ΔCt was calculated for each FFPE and the corresponding frozen sample. Mean amplification in each of the three FFPE subgroups (columns in different shades of gray) is shown in relation to the mean amplification in the group “frozen” (white columns, SEM < 2%). The expression ratio FFPE/frozen was calculated as 2−ΔCt with ΔCt = mean Ct of the FFPE subgroup − mean Ct of the frozen samples. An expression ratio of 1 indicates comparable transcript amplification in FFPE compared with frozen tissue. Error bars represent standard error of the mean (SEM).