Figure 1.

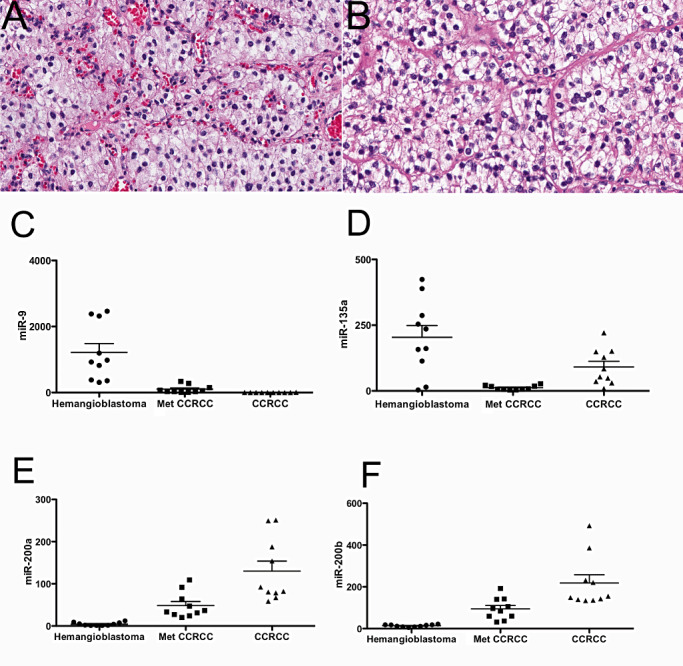
MiRNA profiles from hemangioblastomas and Met CCRCC. H&E sections from hemangioblastoma (A) and Met CCRCC (B) show histologically similar features (40X). Tumor cells are composed of vacuolated or lipidized cells embedded in an extensive vasculature network. MiRNA expression levels by microarray assays showed significantly more miR‐9 (P < 0.001) (C) and miR‐135 (P < 0.001) (D) in hemangioblastomas compared with Met CCRCC. Significantly less miR‐200a (P < 0.0001) (E) and miR‐200b (P < 0.0001) (F) were detected in hemangioblastomas compared with Met CCRCC. Met CCRCC = CNS metastatic clear cell renal cell carcinoma; CCRCC = primary clear cell renal cell carcinoma. Data were analyzed using analysis of variance (anova) with 95% confidence intervals.
