
Figure 2.
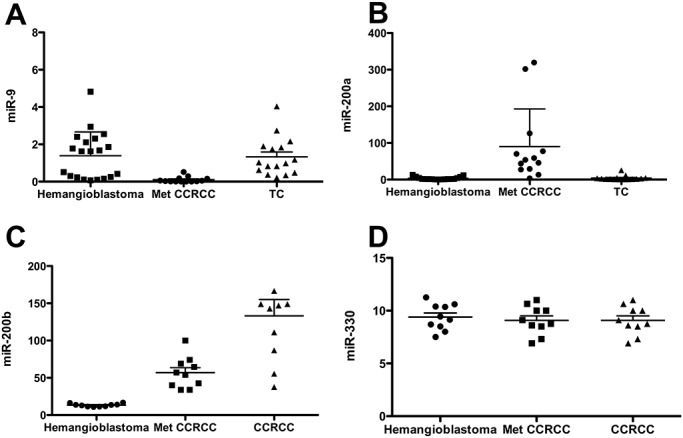
qQT‐RT‐PCR shows greater abundance of miR‐9 and lower abundance of miR‐200a/200b in hemangioblastomas compared with Met CCRCC. Quantitative real‐time RT‐PCR was used to assess miRNA expression in hemangioblastomas and Met CCRCC. MiR‐9 was significantly more abundant in hemangioblastomas compared with Met CCRCC (P = 0.002) (A). MiR‐200a (P = 0.0001) (B) and miR‐200b (P < 0.0001) (C) showed significant lower abundance in hemangioblastomas compared with Met CCRCC. MiR‐330 was unchanged (P = 0.8316) and served as a control (D). Met CCRCC = CNS metastatic clear cell renal cell carcinoma; TC = temporal cortex; CCRCC = primary clear cell renal cell carcinoma. Data were analyzed using analysis of variance (anova) with 95% confidence intervals.