
Figure 1.
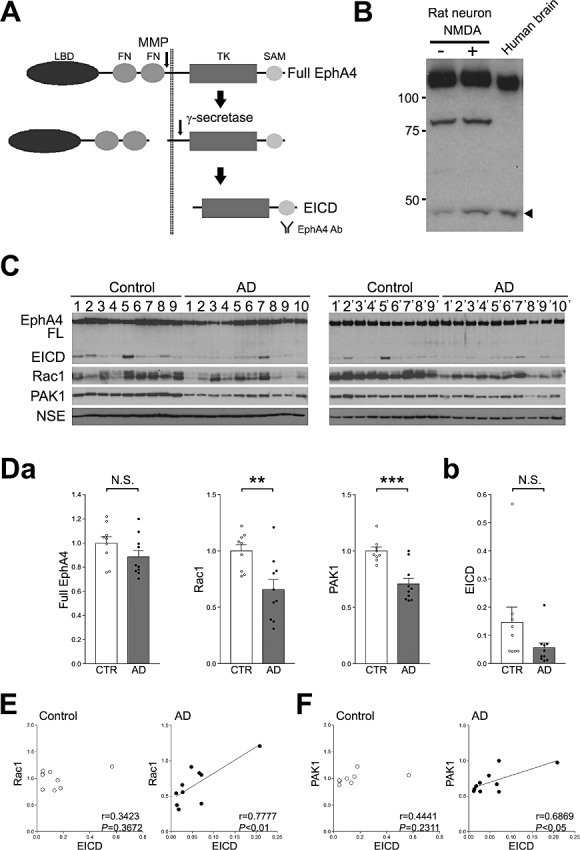
Analysis of the amount of EICD in the frontal lobes of AD patients. A. Schematic diagram of the processing of EphA4. LBD, ligand‐binding domain; FN, fibronectin domain; TK, tyrosine kinase domain; SAM, SAM domain; EICD, EphA4 intracellular domain. B. Detection of EICD in the human brain. As a control, rat hippocampal neurons were treated with 50 µM NMDA. The EICD bands from the hippocampal cell lysate and human brain homogenate were analyzed by Western blotting. The arrow head indicates the cleaved EICD. C. Western blotting analyses of EphA4, Rac1, PAK1 and NSE. Homogenates of the frontal lobes of AD patients and age‐matched controls were analyzed by Western blotting using the indicated Abs. D. (a) Quantitation of the amount of the full‐length of EphA4, Rac1 and PAK1. Band intensities were quantitated as a ratio of NSE, and normalized to the average amount of each protein. (b) Quantitation of the amount of EICD. Band intensities were quantitated as a ratio of the full‐length EphA4. Data are expressed as means ± SEM. **P < 0.01; ***P < 0.001; NS, no significance. E. Correlations between the amounts of EICD and Rac1. The level of Rac1 was plotted against the level of EICD. F. Correlations between the amounts of EICD and PAK1. The level of PAK1 was plotted against the level of EICD. A linear regression line is shown when the correlation reached statistical significance.