
Figure 2.
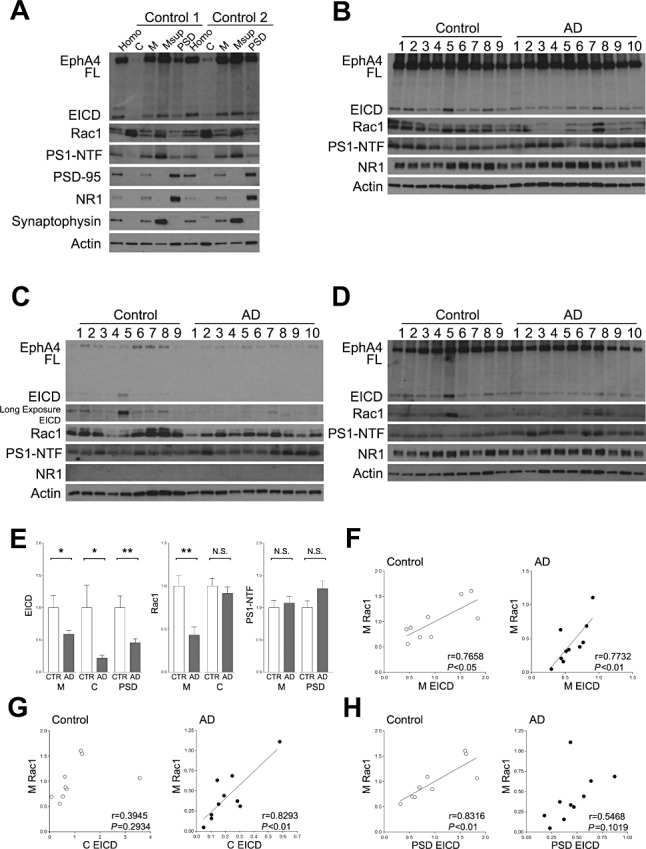
Subcellular distribution of the components of the EICD signaling pathway. A. Subcellular distribution. Homogenates of the frontal lobes were subjected to subcellular fractionation. Each fraction was analyzed by Western blotting using the indicated Abs. Homo, homogenate; C, cytosol fraction; M, membrane fraction; Msup, Triton X‐100 soluble membrane fraction; PSD, PSD fraction; PS1, presenilin1; NTF, N‐terminal fragment. B. Analyses of the membrane fraction. The membrane fractions were analyzed by Western blotting using the indicated Abs. C. Analyses of the cytosol fraction. The cytosol fractions were analyzed by Western blotting using the indicated Abs. D. Analyses of the PSD fraction. The PSD fractions were analyzed by Western blotting using the indicated Abs. E. Quantitation of the amounts of EICD, Rac1 and presenilin1. Band intensities were quantitated as a ratio of actin, and normalized to the average amount of each protein. Data are expressed as means ± SEM. *P < 0.05; **P < 0.01; NS, no significance. F. Correlation between the level of EICD and Rac1 in the membrane fraction. The level of Rac1 in the membrane fraction was plotted against the level of EICD in the membrane fraction. G. Correlation between the level of EICD in the cytosol fraction and Rac1 in the membrane fraction. The level of Rac1 in the membrane fraction was plotted against the level of EICD in the cytosol fraction. H. Correlation between the level of EICD in the PSD fraction and Rac1 in the membrane fraction. The level of Rac1 in the membrane fraction was plotted against the level of EICD in the PSD fraction. A linear regression line is shown when the correlation reached statistical significance.