
Figure 3.
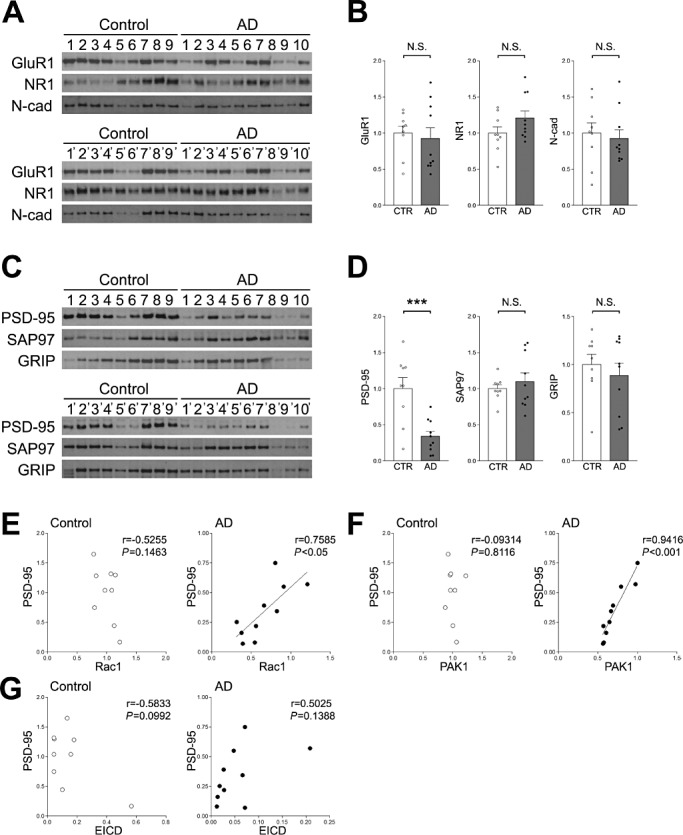
Analyses of various synapse proteins in the frontal lobe. A. Western blotting analyses of GluR1, NR1 and N‐cadherin. Homogenates of the frontal lobes of AD patients and age‐matched controls were analyzed by Western blotting using the indicated Abs. B. Quantitation of the amounts of GluR1, NR1 and N‐cadherin. Band intensities were quantitated as a ratio of NSE, and normalized to the average amount of each protein. Data are expressed as means ± SEM. NS, no significance. C. Western blotting analyses of PSD‐95, SAP97 and GRIP. Homogenates of the frontal lobes of AD patients and age‐matched controls were analyzed by Western blotting using the indicated Abs. D. Quantitation of the amounts of PSD‐95, SAP97 and GRIP. Band intensities were quantitated as a ratio of NSE and normalized to the average amount of each protein. Data are expressed as means ± SEM. ***P < 0.001; NS, no significance. E. Correlations between the amounts of PSD‐95 and Rac1. The level of PSD‐95 was plotted against the level of Rac1. F. Correlations between the amounts of PSD‐95 and PAK1. The level of PSD‐95 was plotted against the level of PAK1. G. Correlations between the amounts of PSD‐95 and EICD. The level of PSD‐95 was plotted against the level of EICD. A linear regression line is shown when the correlation reached statistical significance.