
Figure 4.
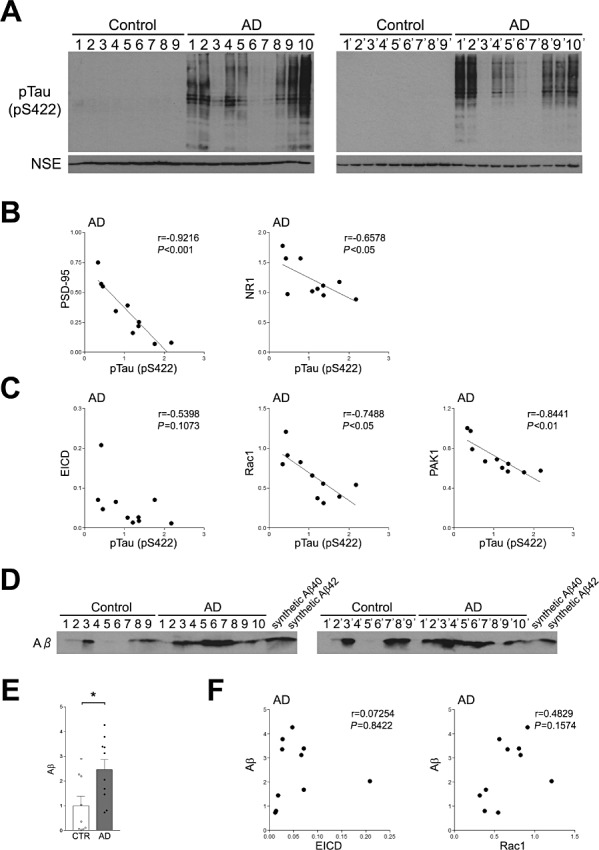
Relationship between EICD signaling and tau phosphorylation. A. Western blotting analysis of phosphorylated tau. Homogenates of the frontal lobes of AD patients and age‐matched controls were analyzed by Western blotting using the anti‐phosphorylated tau Ab. B. Correlations between the amounts of phosphorylated tau and PSD‐95 or NR1 in AD individuals. The levels of PSD‐95 and NR1 were plotted against the level of phosphorylated tau. C. Correlations between the amounts of phosphorylated tau and EICD, Rac1 or PAK1 in AD individuals. The levels of EICD, Rac1 and PAK1 were plotted against the levels of phosphorylated tau. A linear regression line is shown when the correlation reached statistical significance. D. Western blotting analysis of Aβ. Homogenates of the frontal lobes of AD patients and age‐matched controls were analyzed by Western blotting using the anti‐Aβ Ab. Synthetic Aβ40 and Aβ42 were used as positive controls. E. Quantitation of the amounts of Aβ. Band intensities were quantitated as a ratio of NSE and normalized to the average amount of each protein. Data are expressed as means ± SEM. *P < 0.05. F. Correlations between the amounts of Aβ and EICD or Rac1 in AD individuals. The level of Aβ was plotted against the levels of EICD or Rac1.