
Figure 5.
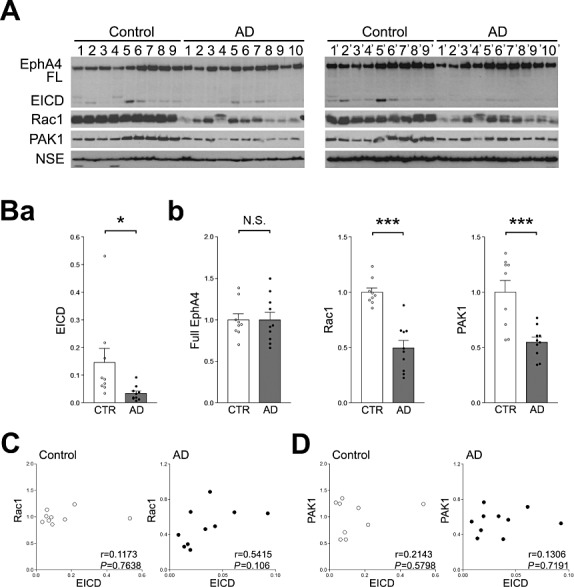
Analysis of the amount of EICD in the occipital lobes of AD patients. A. Western blotting analyses of EphA4, Rac1, PAK1 and NSE in the occipital lobes of AD patients. Homogenates of the occipital lobes of AD patients and age‐matched controls were analyzed by Western blotting using the indicated Abs. B. (a) Quantitation of the amount of EICD. Band intensities were quantitated as a ratio of full‐length EphA4. (b) Quantitation of the amounts of full‐length EphA4, Rac1 and PAK1. Band intensities were quantitated as a ratio of NSE and normalized to the average amount of each protein. Data are expressed as means ± SEM. *P < 0.05; ***P < 0.001; NS, no significance. C. Correlations between the amounts of EICD and Rac1. The level of Rac1 was plotted against the level of EICD. D. Correlations between the amounts of EICD and PAK1. The level of PAK1 was plotted against the level of EICD.