
Figure 1.
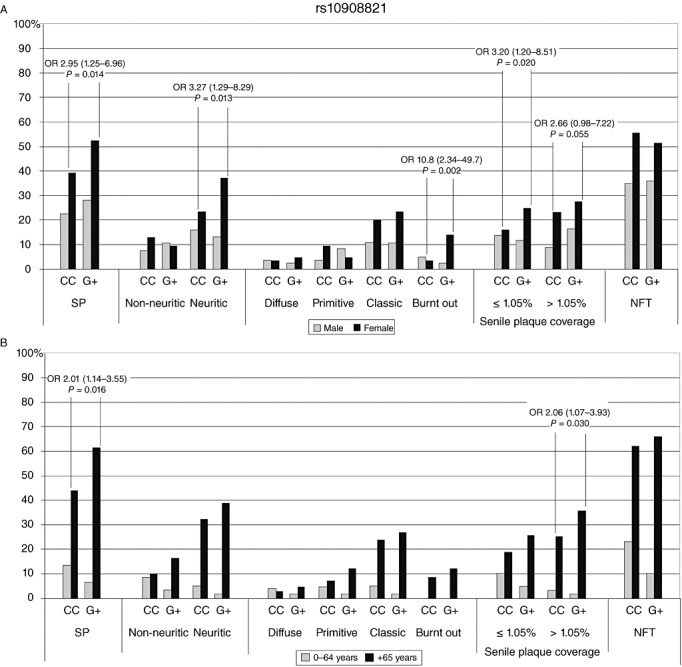
SNP rs10908821 prevalence (%) of SP and NFT against genotypes. (A) Grey indicates men and black for women; (B) grey indicates 0–64‐year‐old individuals and black refers to those over 65 years. NFT = neurofibrillary tangles; OR = odds ratio; SNP = single‐nucleotide polymorphism; SP = senile plaques.