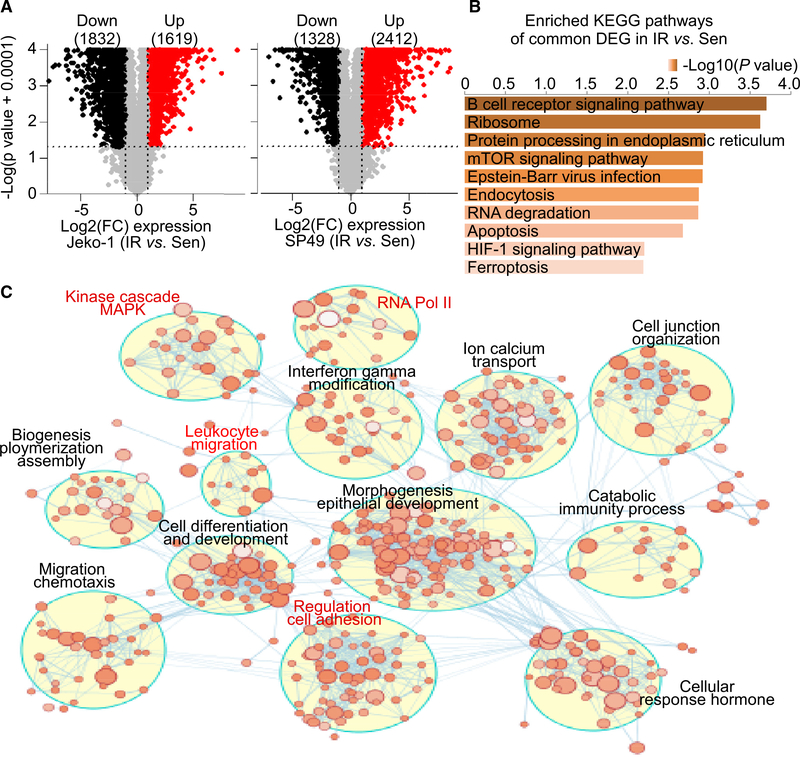
Figure 1. Transcriptome reprograming rewires kinome signaling in IR MCL.
(A) Volcano plots highlighting genes differentially expressed in IR versus parental sensitive (Sen) Jeko-1 (left) and SP49 (right) cells. The numbers of significant differentially expressed upregulated genes (red) or downregulated genes (black) are included in parentheses. Log2(FC): log2 FC cut-off of log2(1.5), p value cut-off of 0.05. n = 3 biologically independent samples.
(B) KEGG pathway analysis of common differentially expressed genes expressed in IR cells compared to Sen cells between SP49 and Jeko-1 using Enrichr. Bar length and top axis represent −log10(p value). Color bar intensity also represents −log10(p value), where the darker colors are indicative of higher significance (lower p value). p value is calculated by hypergeometric test (Chen et al., 2013; Kuleshov et al., 2016).
(C) Enrichment map of IR-associated genes in Jeko-1-IR cells. The map displays the enriched gene sets in Jeko-1-IR cells. Nodes represent gene sets, and edges represent overlap between gene sets. Gene sets that did not pass the enrichment significance threshold are not shown. Clusters of functionally related gene sets were assigned a label using “AutoAnnotate” add-in in Cytoscape; node color intensity is proportional to enrichment significance, and clusters of biological and functional interest for their roles in IR are highlighted in red.

