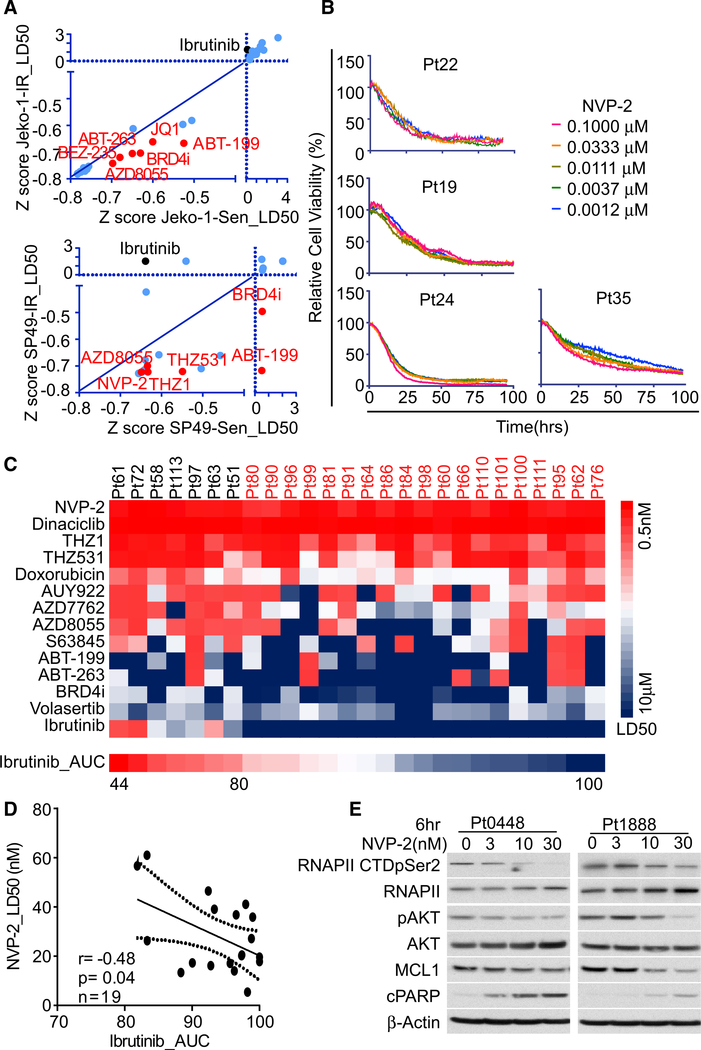
Figure 2. IR MCL cells are highly sensitive to CDK9 inhibition.
(A) Z scores of normalized LD50s of drug response curves from drug screening performed in paired IR and Sen cells for both Jeko-1 and SP49 cells. Compounds that have higher potency in IR cells are highlighted and labeled in red.
(B) Drug response assessment of NVP-2 potency in primary MCL specimens using EMMA platform.
(C) Heatmap of LD50s calculated from EMMA drug response assays in primary MCL patient specimens. Red represents low LD50 (sensitive), and blue represents high LD50 (resistant). Patients that are defined as IR by LD50 are highlighted in red font.
(D) Pearson correlation between Ibrutinib sensitivity (AUC) and NVP-2 sensitivity (LD50) from EMMA experiments performed on primary IR MCL samples (n = 19) defined as in (C). Dotted line represents boundary for 95% confidence interval (CI).
(E) NVP-2 treatment suppresses RNA polymerase II (RNAPII) CTD pSer2, pAKT, MYC, and MCL-1 levels and augments PARP cleavage in primary MCL patient samples (Pt0448, Pt1888) in a dose-dependent fashion.
Data shown in (A) and (E) are representatives of three independent experiments.

