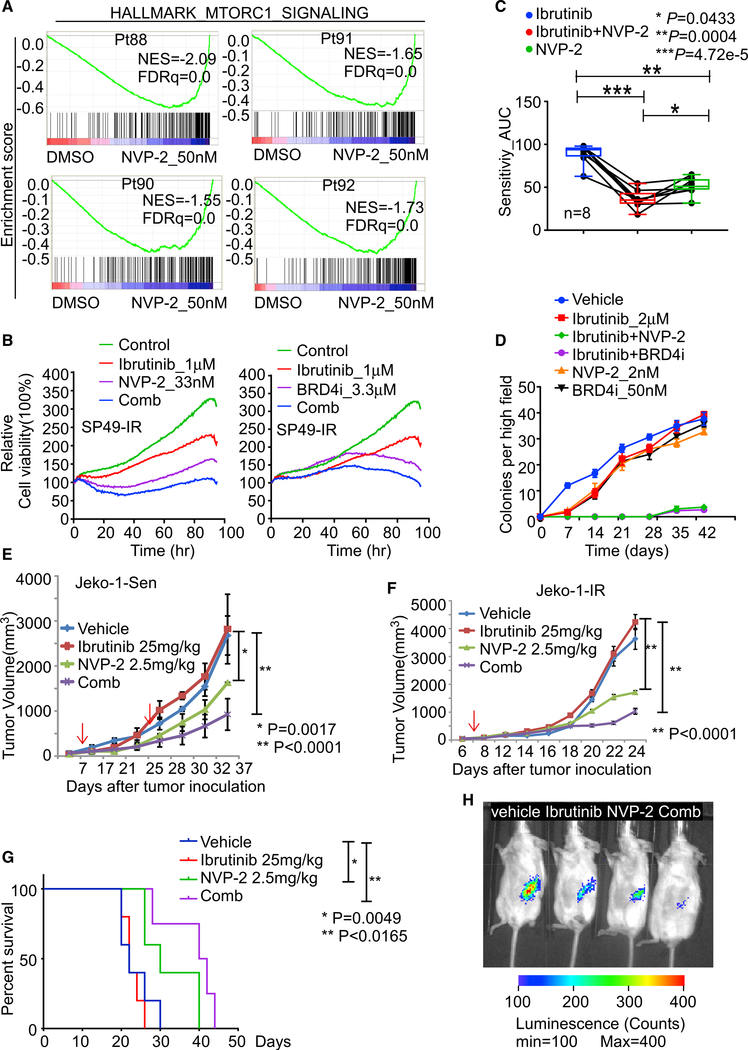
Figure 5. Targeting CDK9 prevents emergence and overcomes IR in MCL ex vivo and in vivo.
(A) GSEA of HALLMARK_MTORC1_SIGNALING pathway for NVP-2 treatment in the indicated IR MCL patient (Pt) specimens.
(B) Cell-based imaging analysis for drug response in SP49-IR cells treated with NVP-2, Ibrutinib, or the NVP-2/Ibrutinib combination (left panel) or with BRD4i (INCB054329), Ibrutinib, or the BRD4i/Ibrutinib combination (right panel).
(C) Drug response assay of primary MCL patient samples (n = 8) treated with Ibrutinib or NVP-2 alone or Ibrutinib/NVP-2 combination. AUC values calculated from cell-based imaging analysis. p values were calculated by one-way ANOVA.
(D) Colony formation analysis revealed the Ibrutinib/NVP-2 and Ibrutinib/BRD4i combination markedly impairs colony formation in HBL-2 MCL cells.
(E) Tumor volume in NSG recipient mice bearing Jeko-1 Sen tumors that were treated daily with Ibrutinib (25 mg/kg, i.p.) or biweekly with NVP-2 (2.5 mg/kg, i.p.) or the Ibrutinib/NVP-2 combination. First arrow, start of drug application; second arrow, onset of drug resistance evolution. p values were calculated by Student’s t test.
(F) Tumor volume in NSG recipient mice bearing Jeko-1-IR tumors that were treated daily with Ibrutinib or biweekly NVP-2, or the Ibrutinib/NVP-2 combination. P values were calculated by Student’s t test.
(G). Kaplan-Meier survival analysis of mice in (F). Mantel-Cox test was used for statistical analysis. For (E) and (F), dosages of the treatment are indicated in the figures. Black arrows indicate treatment start time, and red arrow in (E) indicates the time that Ibrutinib group tumor sizes are larger than vehicle group.
(H), Representative images taken 6 weeks after transplant of NSG mice bearing IR MCL PDX tumors that were treated with vehicle, Ibrutinib daily, biweekly NVP-2, or NVP-2/Ibrutinib combination. n is at least 4 for each group. Dosages of the treatment are same as (F).
For (E) and (F), data are shown as mean ± SD. For (E)–(G), n = 4 mice per treatment group. Data in (B) and (D) are representative of three independent experiments run in triplicate.

