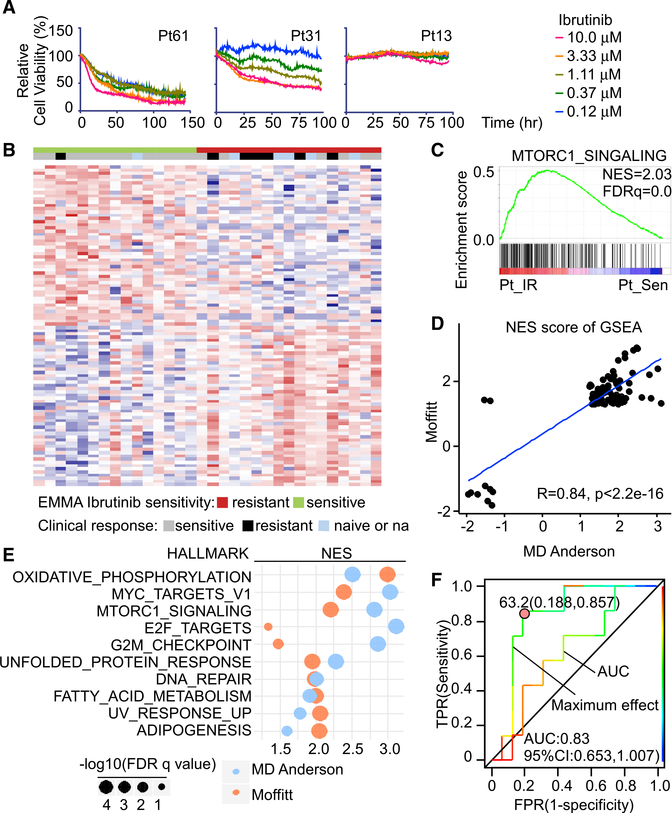
Figure 6. The EMMA platform predicts clinical responses and informs vulnerabilities in primary and IR MCL.
(A) Drug response assays of Ibrutinib sensitivity in primary patient samples with cell-based imaging analysis showing representative dose responses of sensitive, intermediate, and resistant primary MCL patients.
(B) Heatmap showing top differential genes between primary IR and Sen MCL samples separated by maximum Ibrutinib effect measured by cell-based imaging analysis. n = 32 primary samples.
(C) GSEA shows MTORC1_SIGNALING is positively enriched in primary IR MCL samples compared to Sen primary MCL samples. NES, normalized enrichment score; FDR, false discovery rate.
(D) Median NES of single-sample GSEA (ssGSEA) reveals the correlation of Moffitt and MD Andersen gene signatures of IR and Sen primary MCL samples.
(E) Shared positively enriched HALLMARK pathways of IR compared to Ibrutinib-sensitive primary MCL samples of Moffitt and MD Andersen datasets.
(F) Receiver operating characteristic (ROC) curves of AUC and maximum effect from cell-based imaging analysis compared to clinical response of patients. AUC and Youden cut-off indexes for maximum effect ROC curve are shown.

