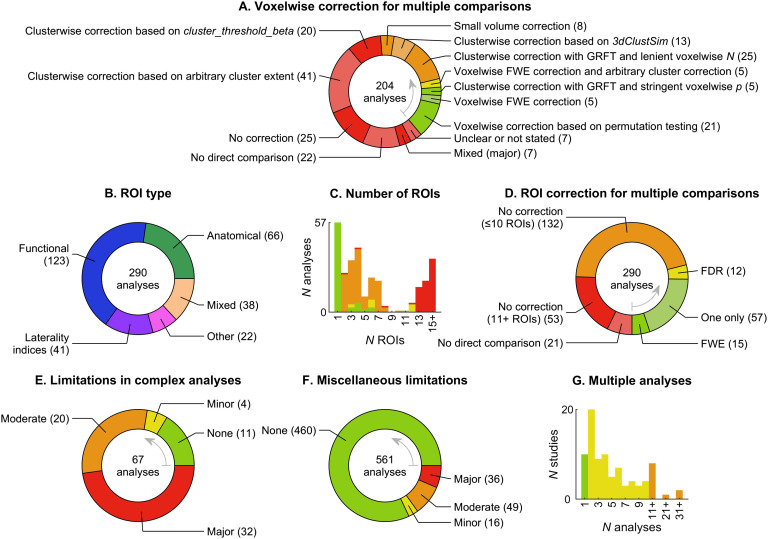
Figure 8. .
Analyses. Donut charts and bar graphs presenting information about correction for multiple comparisons and other limitations in the 561 relevant analyses. GRFT = Gaussian random field theory; FWE = familywise error; FDR = false discovery rate. See Figure 3 caption for more information.

