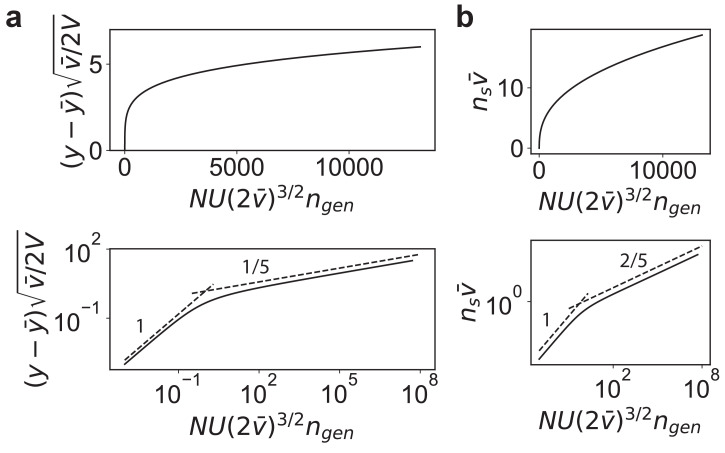
Appendix 1—figure 1. The mean fitness trajectory and the mean number of substitutions predicted by the model in the strong-selection-weak-mutation regime.
(a) The scaled fitness vs. scaled time. Shown below is the fitness in log-scale to highlight the different scalings in the neutrally adapted and well-adapted regimes. The slopes of the dashed lines are shown. (b) The scaled number of substitutions vs. scaled time as in (a).

