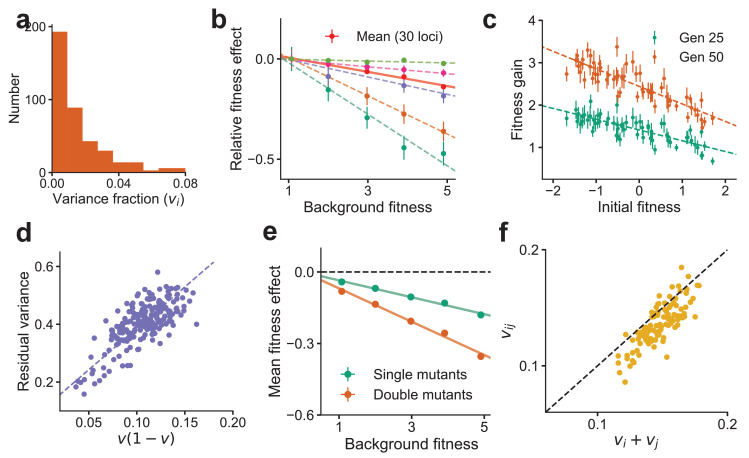
Figure 2. Global epistasis is recapitulated in a generic model of a complex trait and leads to testable predictions.
(a) The distribution of variance fractions over 400 loci for the simulated genotype-phenotype map. (b) The predicted linear relationship between fitness effect (relative to the fitness effect on the least fit background) and background fitness for the mean over 30 randomly chosen loci (red, solid line) and five loci (dashed lines in colors) is recapitulated. The slope of the linear fit for each locus is proportional to its variance fraction, (slope = ). Mean and SE are over backgrounds of approximately equal fitness. See Materials and methods for more details. (c) The mean fitness gain after 25 (green) and 50 (orange) generations of simulated evolution of 768 independently adapting populations with 64 unique founders and 12 replicates each. Means and SEs are computed over the 12 replicates. Error bars are s.e.m. (d) The relationship predicted from theory between the residual variance from the linear fit for each locus and its slope is confirmed in simulations. (e) The mean fitness effect for single mutants at 30 loci and double mutants from all possible pairs of the 30 loci. The slope for the double mutants is predicted to be roughly twice that of single mutants. (f) The estimated variance fraction of a double mutant with mutations at two loci is predicted from theory and confirmed in simulations to be approximately the sum of the variance fractions for single mutations at the two loci. Sub-additivity is due to epistasis between the two loci. See Materials and methods for more details.

