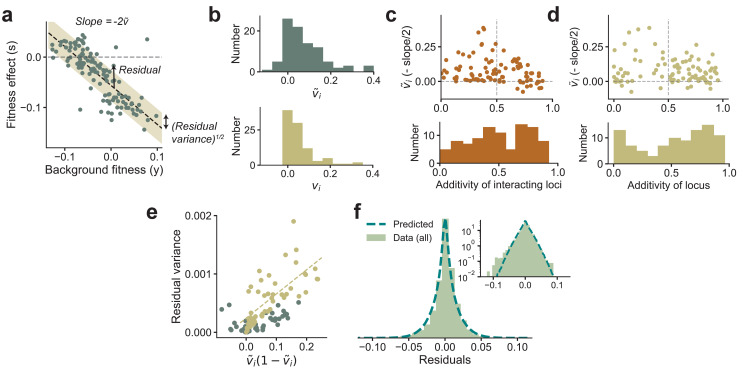
Figure 3. Experimental observations from Johnson et al., 2019 are consistent with theoretical predictions.
(a) The fitness effect of one of the 91 mutations from Johnson et al., 2019 plotted against background fitness. (b) The distribution of the measured (negative one-half of the slope from a) and variance fractions vi for the 91 insertion mutations. (c, d) plotted against the additivity of interacting loci (AoIL) and the additivity of the mutated locus (see main text for definitions). The histograms are shown below the plots. The sign of the trend depends on the AoIL rather than the additivity of the mutated locus. (e) The measured variance of the residuals against the prediction , shown here for the 91 mutations. The yellow circles correspond to the loci with AoIL lt0.5. The best-fit line (yellow dashed line) to these loci has ( for all points). (f) The shape of the distribution of residuals pooled from all 91 mutations aligns well with the prediction from Equation (3). The variances of the two distributions are matched. Inset: same plot in log-linear scale. See Materials and methods for more details.

