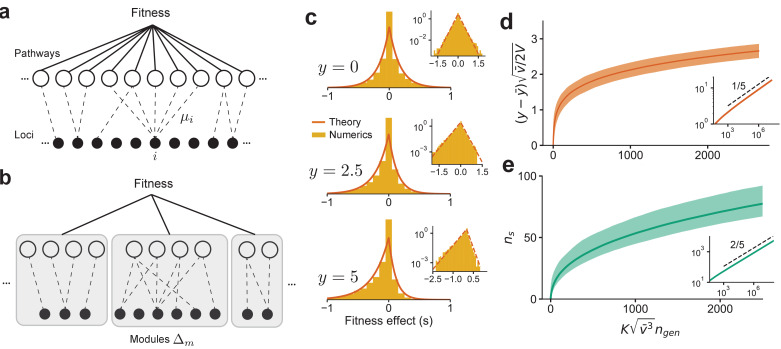
Figure 4. The distribution of fitness effect (DFE) and long-term adaptation dynamics predicted for the connectedness model.
(a) Schematic of the connectedness (CN) model, where each locus is associated with a fraction µ of pathways that contribute to the organism’s fitness. (b) An alternative model with modular organization, where sets of loci interact only within the pathways specific to a single module. (c) The DFE predicted from Equation (14) matches those obtained from simulated evolution of genotypes from the CN model. 128 randomly drawn genotypes (400 loci) with initial fitness close to zero are evolved to and , and the DFE is measured across loci and genotypes. We chose and so that represents adaptedness. Insets: same plots in log-linear scale. Note that the number of beneficial mutations acquired during the simulated evolution (10-20) is much less than the total number of loci (400). (d) For a neutrally adapted organism, the theory predicts quick adaptation to a well-adapted state beyond which the adaptation dynamics are independent of the specific details of the genotype-fitness map. Shown here is the mean adaptation curve predicted under strong-selection-weak-mutation (SSWM) assumptions, which leads to a power-law growth of fitness with exponent 1/5 in the well-adapted regime (inset). (e) The number of fixed beneficial mutations under SSWM, which grows as a power-law with exponent 2/5 in the well-adapted regime (inset). The shaded region is the 95 confidence interval around the mean for (c) and (d). See Materials and methods and SI for more details.

