. 2021 Apr 20;10:e65948. doi: 10.7554/eLife.65948

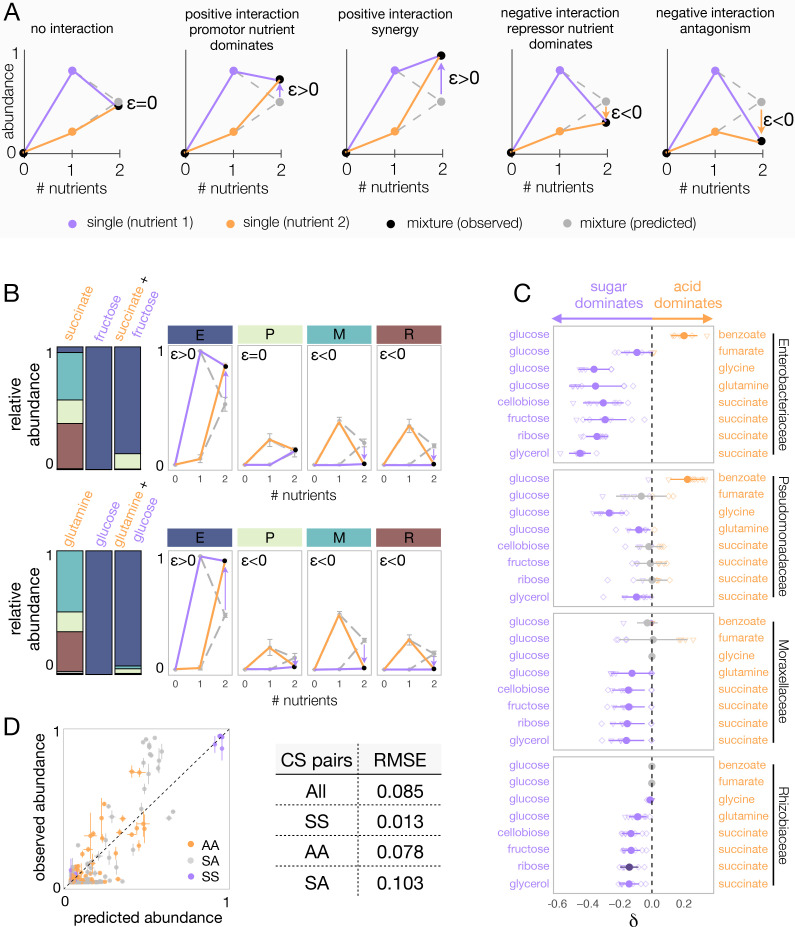
Figure 3. Sugars generally dominate over organic acids.

(A) Detecting interactions and hierarchies of dominance between nutrients on microbial community composition. Drawing the single and pairwise abundance landscapes for each species allows us to visualise interactions between nutrients. Multiple types of interactions are possible, including dominance, synergy, and antagonism. Interactions occur when ε is significantly different from 0 (Materials and methods). Synergy (antagonism) occurs when the abundance in the mixture is greater (lower) than the abundances in any of the single nutrients independently (Materials and methods). Dominance occurs when the abundance in the mixture is closer or similar to the abundance in one of the singles. The landscape also allows us to identify which carbon source has a dominating effect within the pair. When ε > 0, the growth-promoting nutrient dominates and has an overriding effect in the community composition. In contrast, when ε < 0, the growth-repressing nutrient dominates. (B) Two examples of nutrient interactions (succinate + fructose and glucose + glutamine) exhibiting sugar dominance. Barplots show a representative replicate from one of the inocula (Figure 2—figure supplements 12). For instance, the landscape for succinate-fructose shows that fructose overrides the effect of succinate by promoting Enterobacteriaceae (E), and repressing Moraxellaceae (M) and Rhizobiaceae (R) (purple arrows), whereas no interaction effect is observed for Pseudomonadaceae (P). Error bars represent mean ± SD of the four replicates. (C) Dominance index for the eight sugar–acid pairs and the four dominant families. Filled circles show the mean ± SD of the two inocula × four replicates for each pair of nutrients, and open symbols show all eight independent replicates (different shapes for different inocula), except for glycine pairs where N = 6. Purple indicates that the sugar dominates while orange indicates that the acid dominates. Lighter purple and orange indicate dominance, while darker purple and orange indicate super-dominance (synergy or antagonism). An interaction occurs when the abundance is greater (ε > 0) or lower (ε < 0) in the carbon source mixture than predicted by the null model (one-tailed paired t-test, p<0.05, N = 8, based on 1000 permutations; Materials and methods). In gray are shown cases where there is no interaction, or when dominance is undefined because the two inocula exhibit opposite dominant nutrient (in which case δ is shown as both –δ and +δ). (D) Predicted vs observed family-level abundance. For each pair of carbon sources (CS), shown is the experimentally observed and predicted (by the null model) relative abundance of each family in the mixed carbon sources. Any deviation from the identity line (predicted = observed) is the interaction effect. The colors show whether the carbon source pairs are sugar–sugar (SS), acid–acid (AA), or sugar–acid (SA). Error bars represent mean ± SE. Table shows RMSE for each carbon source pair type.

Figure 3.

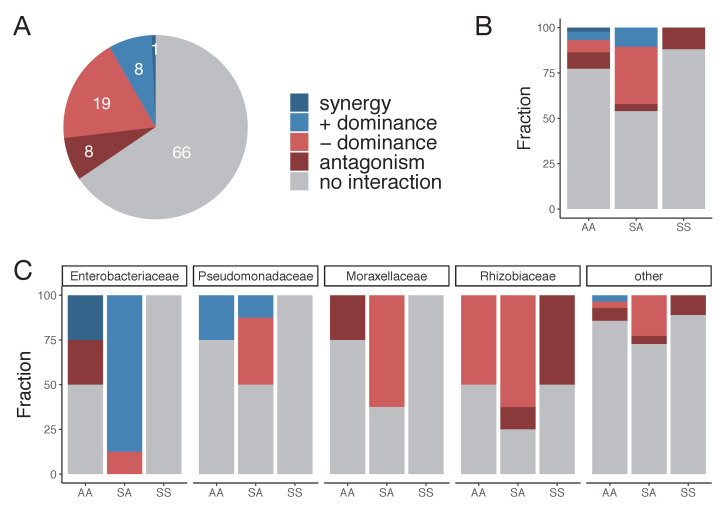
Figure 3—figure supplement 1. Dominance is the most common type of nutrient interaction, especially in the sugar–acid mixtures.

Figure 3—figure supplement 1.

(A) Interaction type for each pair of carbon source and family. An interaction between nutrients occurs when the abundance in the mixture is significantly greater or lower than predicted by the null additive model (one-tailed paired t-test, p<0.05 based on 1000 permutations; only cases where N ≥ 6 unique pairs are considered) (Materials and methods). Multiple types of nutrient interaction are possible: dominance, synergy, and antagonism. Synergy (antagonism) occurs when the abundance in the mixture is greater (lower) than the abundances in any of the single nutrients independently (Welch two sample t-test, p<0.05) (Materials and methods). Dominance occurs when the abundance in the mixture is closer or similar to the abundance in one of the singles. (B) Interaction type by carbon source pair type. AA: mixture of two acids; SS: mixture of two sugars; and SA: mixture of a sugar and an acid. (C) Interaction type shown for the four most abundant families and ‘other’ families grouped together.
Figure 3—figure supplement 2. Family-level dominance for mixtures of acid–acid and sugar–sugar.

Figure 3—figure supplement 2.

For each carbon source pair, the filled circles show the mean ± SD of N = 8 unique replicates (two inocula × four replicates each), and the open symbols show all eight replicates individually (except for glycine pairs where N = 6). The different shapes correspond to different inocula. When δ < 0, the focal carbon source (succinate or glucose) dominates. When δ > 0, the additional carbon source dominates (Materials and methods). Orange or purple corresponds to cases where nutrients interact, in which case there is dominance (or super-dominance). An interaction occurs when the abundance observed in the mixture is significantly greater (ε > 0) or lower (ε < 0) than predicted by the null additive model (one-tailed paired t-test, p<0.05, based on 1000 permutations; see Materials and methods). Gray corresponds to cases where nutrients do not interact or dominance is undefined because one carbon source dominates in one of the inocula and the paired carbon source dominates in the other inocula (in which case δ is shown as both −δ and ). Lighter orange or purple indicates dominance while darker orange or purple indicates super-dominance (synergy or antagonism) (Materials and methods). Only the four most dominant families are shown.
Figure 3—figure supplement 3. Patterns of nutrient interaction at the genus level.

Figure 3—figure supplement 3.

(A) Multiple types of nutrient interactions are possible, including dominance, synergy, and antagonism (Figure 3A). An interaction occurs when ε is significantly greater or lower than 0 (one-sided paired t-test, p<0.05 based on 1000 permutations, Materials and methods). Inocula are considered separately, and only cases where N ≥ 3 unique pairs are considered. Synergy (antagonism) occurs when the abundance in the mixture is greater (lower) than the abundances in any of the singles separately. Dominance occurs when the abundance in the mixture is closer or similar to one of the single abundances but not above or below any of the single abundances independently (Materials and methods). (B) Interaction type by carbon source pair type. AA: mixture of two acids; SS: mixture of two sugars; and SA: mixture of a sugar and an acid. (C) Interaction type is broken down by the 10 most abundant genera spanning the Enterobacteriaceae family (blue), Pseudomonadaceae (light purple), Moraxellaceae (dark purple), and Rhizobiaceae (orange) families. Note that Enterobacteriaceae.8 is a non-identified genus belonging to the Enterobacteriaceae family. The other genera are grouped together and shown as ‘other’.
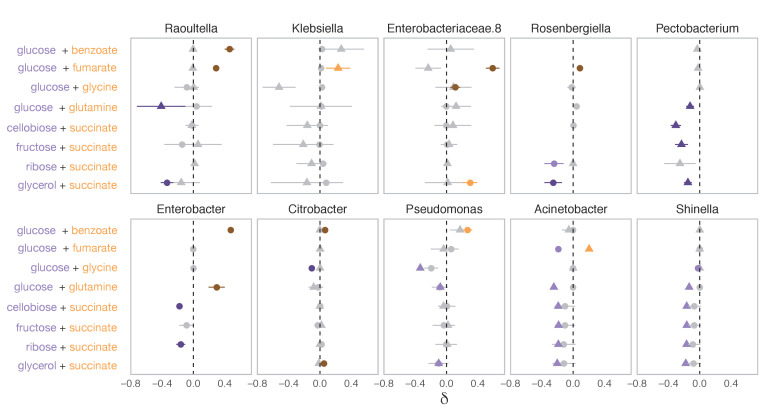
Figure 3—figure supplement 4. The systematic dominance of sugars observed at the family level does not apply to the genus level.

Figure 3—figure supplement 4.

To determine the genus-level dominance, the two inocula are considered separately (different shapes) as the genera that are sampled in one inocula may not be sampled in the other inocula. Purple indicates that the sugar dominates while orange indicates that the acid dominates. Lighter purple and orange indicate dominance, while darker purple and orange indicate super-dominance (synergy or antagonism) (Materials and methods). No interaction is shown in gray. An interaction occurs when ε is significantly greater or lower than 0 (one-sided paired t-test, p<0.05 based on 1000 permutations, Materials and methods). Shown are the 10 most abundant genera (mean ± SD). Note that Enterobacteriaceae.8 is a non-identified genus of the Enterobacteriaceae family.