. 2021 Apr 20;10:e65948. doi: 10.7554/eLife.65948

Figure 4. Family-level asymmetry in nutrient benefits can lead to dominance.

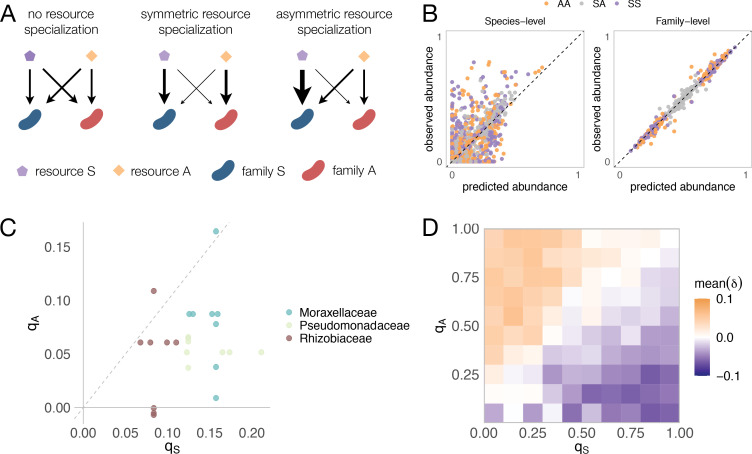
(A) Schematic illustrating different scenarios of nutrient preference. There are two families (FS and FA) and two resource classes (RS and RA). Without resource specialization, FS and FA have equal access to RS and RA. With symmetric specialization, each family prefers its own resource class with the same strength. With asymmetric specialization, one family (FS) has better access to its own resource class (RS) relative to that of the other family (FA) on its own resource class (RA). (B) A mechanistically explicit consumer-resource model that incorporates resource competition, resource specialization and nonspecific cross-feeding (Materials and methods) recovers the predicted additivity pattern at both the species (left) and family (right) level of taxonomic organization. The observed relative abundance of each species or family in 300 communities grown on a different pair of nutrients (100 AA, 100 SS, and 100 SA) is plotted against the abundance predicted from the same communities grown on each of the relevant single nutrients (S, A). Each family specializes equally on its preferred nutrient (qS = qA = 0.9) as in previous work (Marsland et al., 2020a). In Figure 4—figure supplement 4, we illustrate representative consumption matrices for different choices of qA and qS. (C) 22 strains were isolated from the assembled communities and their growth rates on minimal M9 media supplemented with one the 10 carbon sources were measured. qS represents the growth rate advantage of Enterobacteriaceae on sugars relative to the other dominant family (colored), while qA represents the growth rate advantage of the other family on the acids relative to Enterobacteriaceae (Materials and methods). When qS is positive, Enterobacteriaceae grow faster on the sugar than the other family, while when qS is negative, Enterobacteriaceae grow more slowly on the sugar than the other family. When qA is positive, the other family grows faster on the acid than Enterobacteriaceae, while when qA is negative, the other family grows more slowly on the acid than Enterobacteriaceae. Each dot corresponds to a sugar-acid pair for a Enterobacteriaceae-other family pair (n = 24). The growth rate advantage of Enterobacteriaceae on sugars is significantly greater than the growth rate advantage of the other families on acids (i.e. qS > qA, mean of differences = 0.069, paired t-test, n = 24, p-value<0.0001). (D) Here we repeat the same simulation as shown in (B), this time using different combinations of qA and qS (0.05, 0.15, 0.25, 0.35, 0.45, 0.55, 0.65, 0.75, 0.85, 0.95). Heatmap shows the mean dominance level (δ) for different combinations of qA and qS. When δ < 0, the sugar dominates (purple); when δ > 0, the acid dominates (orange).

Figure 4.

Figure 4—figure supplement 1. Enterobacteriaceae generally have a strong growth advantage in sugars.

Figure 4—figure supplement 1.

Twenty-two strains belonging to the four dominant families, namely Enterobacteriaceae (7), Pseudomonadaceae (5), Moraxellaceae (6), and Rhizobiaceae (4) were isolated from the self-assembled communities and their growth rate on the 10 carbon sources was measured (Materials and methods, Supplementary file 1b). The average growth rate is measured as the mean cell divisions from 0.5 hr to 16 hr of growth (three or four replicates each) (Materials and methods). Thus, this approach takes into account both lag and growth rate, two growth traits that are important in determining the competitive ability of a strain. We use the first 16 hr of growth rather than a longer time window to better assess growth rate on the supplied nutrient and avoid potential artifacts from growth on secretions. Significance level (p-value) is measured by comparing the average growth rate between Enterobacteriaceae (reference) and each other family (paired t-test, ****p<0.0001; ***p<0.001; **p<0.01; *p<0.1).
Figure 4—figure supplement 2. Stochastic colonization has no qualitative effect on the pattern of additivity found using a Microbial Consumer Resource Model.

Figure 4—figure supplement 2.

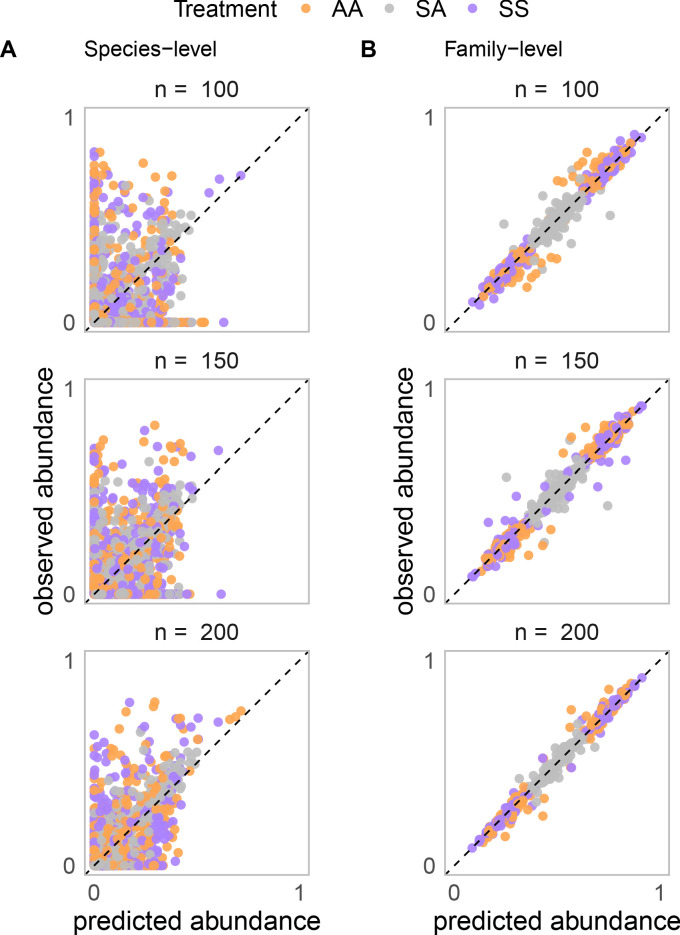
Relative abundance of each species (A) or species grouped by family (B) in simulated communities grown in a mixture of nutrients plotted against the predicted relative abundance from simulated communities grown in single nutrients assuming that nutrients act independently (Materials and methods). Communities are colonized with n species, randomly sampled from a regional pool of 200 species, while keeping the number of families constant. When n = 200, all species are sampled. Decreasing n reduces the initial species variability of the community and also introduces stochastic colonization through the random sampling of the regional species pool. For each n, the result of 100 simulations for communities grown in three carbon source pairs is shown (1 SS pair, 1 AA pair, and 1 SA pair).
Figure 4—figure supplement 3. The predictive accuracy of the null model decreases with lower levels of resource specialization.

Figure 4—figure supplement 3.

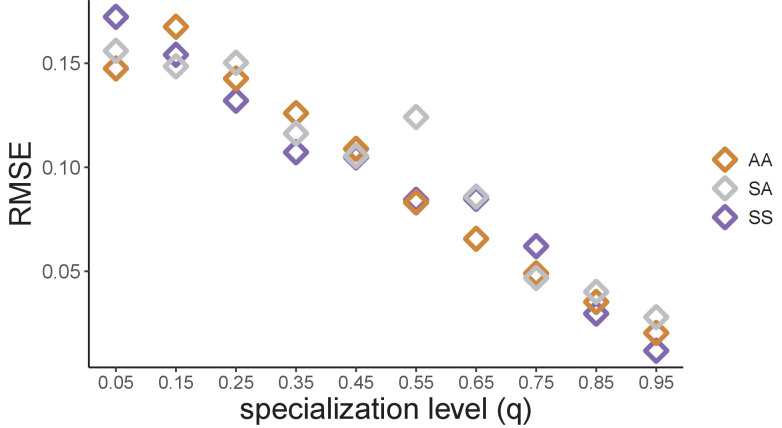
In Figure 4B (right-hand panel), we performed consumer-resource model simulations and plotted the observed and predicted relative abundance of each family in 300 communities grown on a different pair of nutrients (100 AA, 100 SS, and 100 SA). In those simulations, each family is specialized on its preferred nutrient (qS = qA = 0.9). Here, we repeat these exact simulations for different degrees of resource specialization (qS = qA ∈ [0.05, 0.15, 0.25, 0.35, 0.45, 0.55, 0.65, 0.75, 0.85, 0.95]). When qS = qA = 0.05, the two families are largely unspecialized whereas when qS = qA = 0.95 both families are largely specialized (Figure 4—figure supplement 4). The predictive accuracy of the null model is quantified using the RMSE calculated across n = 100 communities.
Figure 4—figure supplement 4. Consumption matrices for different patterns of nutrient preference between families used in the consumer-resource model simulations.

Figure 4—figure supplement 4.

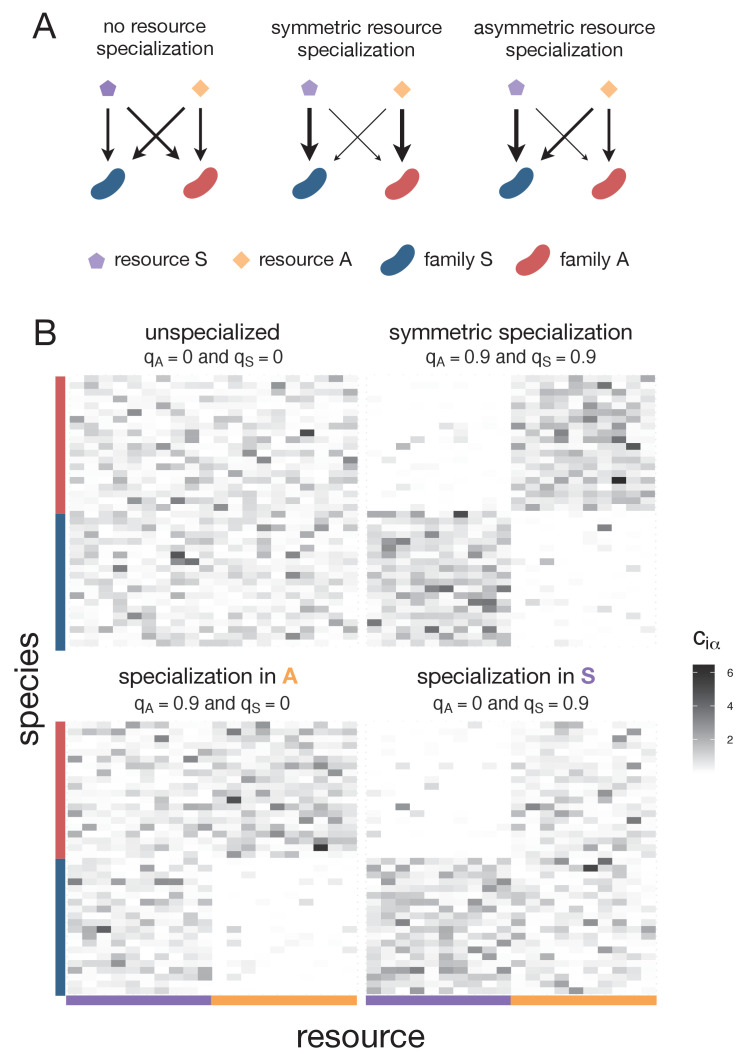
(A) The schematics illustrate different scenarios of nutrient preference for two families (FS and FA) and two resource classes (RS and RA). Without resource specialization, FS and FA have equal access to RS and RA. With symmetric specialization, each family prefers its own resource class with the same strength. With asymmetric specialization, one family (FS) has better access to its own resource class (RS) relative to that of the other family (FA) on its own resource class (RA). (B) Consumption matrices for two families (FA and FS coloured in orange and purple respectively) in two resource classes (RS and RA). Each row corresponds to a different species (for visualization purposes we show 30 species per family) and each column corresponds to a different nutrient within a resource class (10 nutrients per resource class). The value c corresponds to the uptake rate of species i in nutrient α. Four nutrient preference patterns are illustrated. Without family-level nutrient preference (specialization), species from the two families have equal access to resources in A (qA = 0) and resources in S (qS = 0). When each family has a strong and quantitatively similar preference for its own resource class, there is symmetric specialization (qA = qS > 0). When family FA has a strong preference for its own resource class A but both families have equal access to resources in S, then qA > 0 and qS = 0. When family FS has a strong preference for its own resource class S but both families have equal access to resources in A, then qS > 0 and qA = 0.
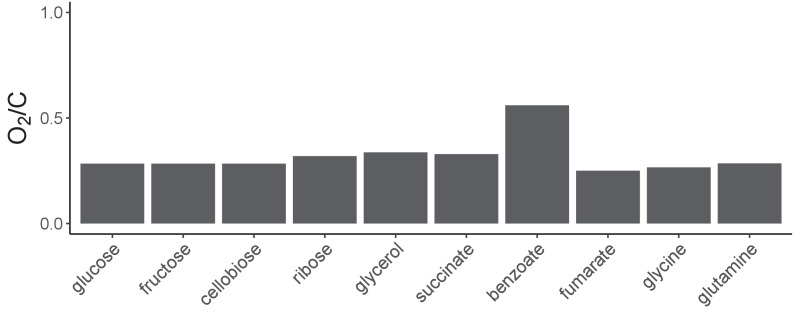
Figure 4—figure supplement 5. Oxygen demands are similar across the different carbon sources.

Figure 4—figure supplement 5.

We carried out flux-balance analysis using a genome-scale metabolic model of E. coli to determine if different carbon sources are likely to exhibit large differences in oxygen demand (Materials and methods). On the y-axis, we plot the oxygen exchange flux/carbon flux for each of the 10 carbon sources used in this study.