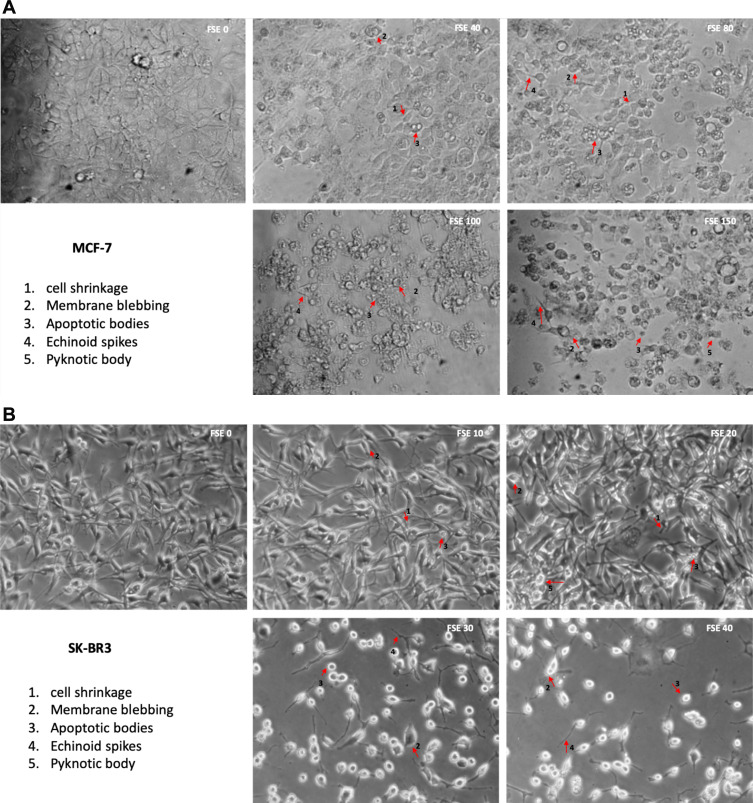
Figure 4.
FSE induced morphological changes in breast cancer cells.
Notes: (A) MCF-7 and (B) SK-BR3 cells (1 × 10⁵) were treated with indicated concentrations of FSE for IC10, IC25, IC35, and IC50 received from cell cytotoxicity assay for 48 hours in 12 well plates. The representative photomicrographs were obtained after 48 hours of the treatment using Optika inverted microscope (Magnification, 100X) and recorded using TBS-3 software. The arrows indicate the morphological changes in the cells as 1. Cell shrinkage, 2. Membrane blebbing, 3. Apoptotic bodies, 4. Echinoid spikes, and 5. Pyknotic body.

