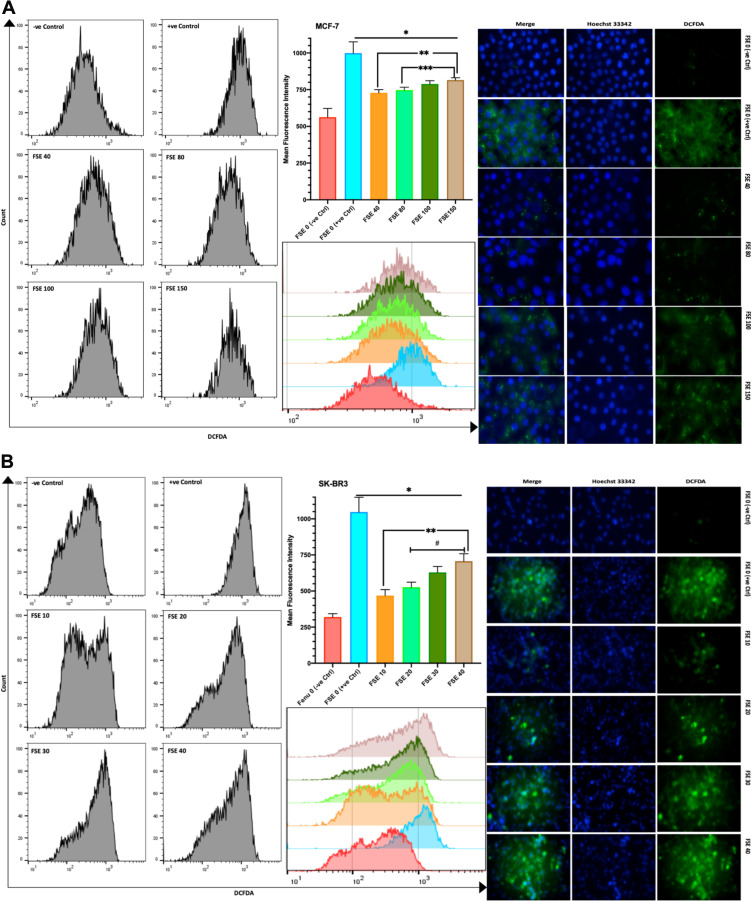
Figure 10.
Effect of FSE on the generation of reactive oxygen species (ROS).
Notes: (A) MCF-7 and (B) SK-BR3 cells (2.5 × 10⁵ cells for flow cytometry and 5 X 10⁴ cells for confocal microscopy) were grown, followed by the treatment with the specified concentrations for 48 hours in 6 well and 24 well plates, respectively. The induction of ROS by FSE in the cells was measured quantitatively and qualitatively using DCFDA by flow cytometry and confocal microscopy (Magnification, 300X), correspondingly. The representative images and analyses of ROS generation as ± SEM of three independent experiments. Statistical differences were analyzed by Ordinary one-way ANOVA, Tukey’s multiple comparison test. *Significant difference vs FSE (+ve Ctrl), **significant difference vs FSE 10 and 40, ***significant difference vs FSE 80, #significant difference between each treated group. The TBHP (50 µM) was added 4 hours prior to staining with DCFDA in FSE 0 (+ve Ctrl) treated cells.
Abbreviations: DCFDA, 2ʹ,7ʹ-dichlorofluorescin diacetate; TBHP, tert-butyl hydrogen peroxide.

