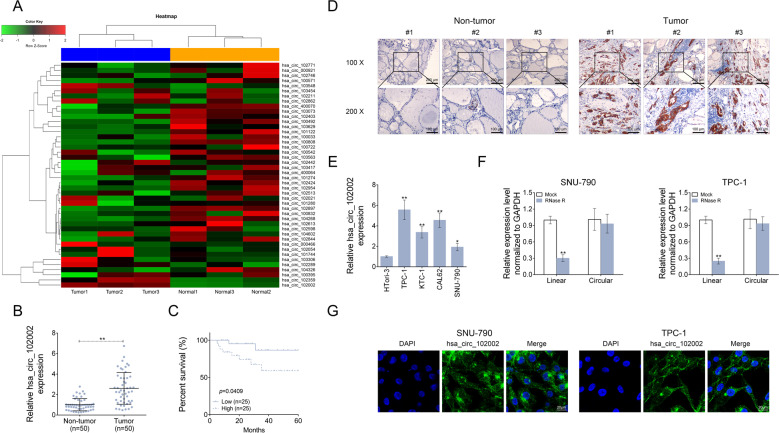
Fig. 1. Hsa_circ_102002 was upregulated in papillary thyroid carcinoma tissues and cells.
a The heatmap of differently expressed circle RNAs in PTC tissues (tumor, n = 3) and normal adjacent tissues (non-tumor, n = 3). b Relative hsa_circ_102002 expression levels in PTC tissues (tumor, n = 50) and normal adjacent tissues (non-tumor, n = 50), as determined using qRT-PCR. c Kaplan–Meier curves of overall survival of 50 PTC patients, stratified by hsa_circ_102002 expression. d Representative images of PTC tissues (tumor, n = 50) and normal adjacent tissues, as determined using ISH. Original magnification, ×40 and ×400. e Relative hsa_circ_102002 expression levels in human normal thyroid cells (HTori-3) and four thyroid cancer cell lines (TPC-1, KTC-1, CAL62, and SNU-790), as determined by qRT-PCR. f Relative linear RNA and circular RNA expression levels in SNU-790 cells after RNase R treatment, as determined using qRT-PCR. g Subcellular localization of hsa_circ_102002 in SNU-790 or TPC-1 cells, as determined using ISH. (mean ± SEM, *p < 0.05, **p < 0.01).

