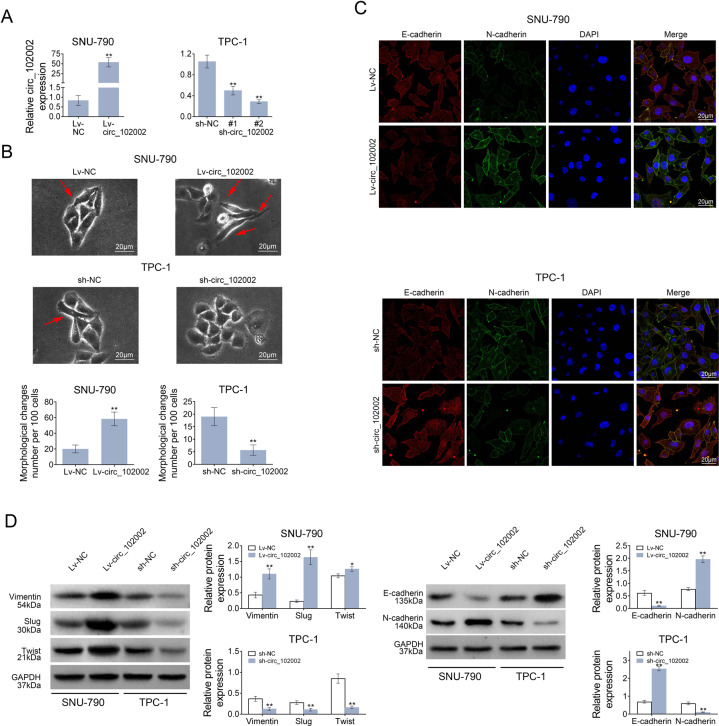
Fig. 2. Hsa_circ_102002 could promote epithelial–mesenchymal transformation of PTC cells.
a Relative hsa_circ_102002 expression levels in Lv-NC or Lv-circ_102002 SNU-790 cells and sh-NC or sh-circ_102002 (sh-circ#1, sh-circ#2) TPC-1 cells. b Representative cellular morphology images of Lv-NC or Lv-circ_102002 SNU-790 cells, and sh-NC or sh-circ_102002 TPC-1 cells. The red arrows point to cells with spindle shape. c Representative images of E-cadherin and N-cadherin in Lv-NC or Lv-circ_102002 SNU-790 cells and sh-NC or sh-circ_102002 TPC-1 cells, as determined using IF (red, E-cadherin; green, N-cadherin; blue, DAPI). d Protein expression levels of E-cadherin, N-cadherin, Vimentin, Slug, and Twist in Lv-NC or Lv- circ_102002 SNU-790 cells and sh-NC or sh-circ_102002 TPC-1 cells, as determined using western blotting. Bands were quantified and shown in histogram. (mean ± SEM, *p < 0.05, **p < 0.01).

