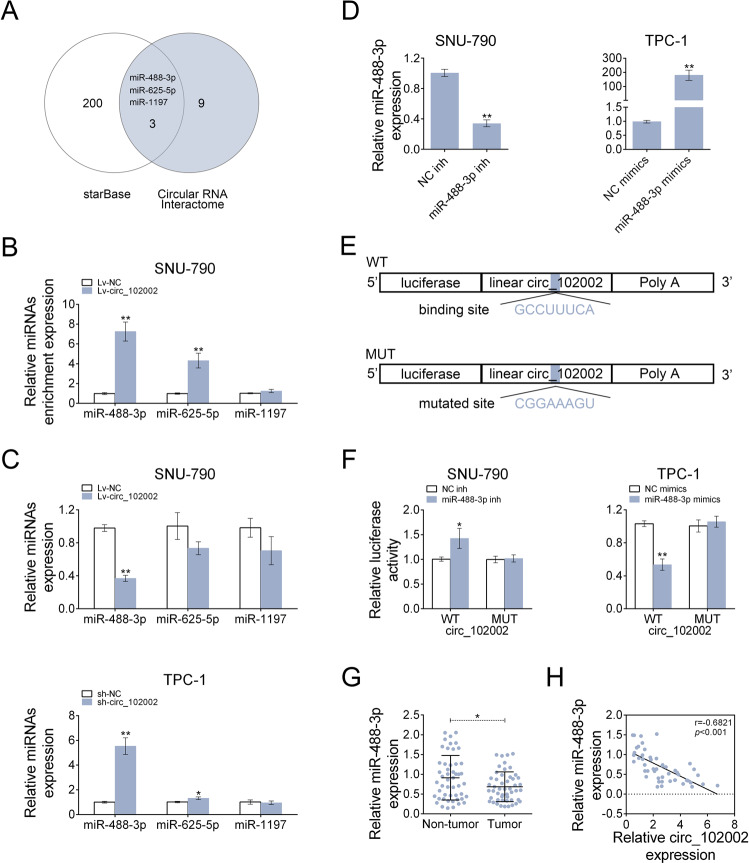
Fig. 4. Hsa_circ_102002 could sponge and negatively regulated miR-488-3p.
a The intersection of potential miRNAs that could be sponged by hsa_circ_102002, as predicted by Circular RNA Interactome and starbase. b Relative enrichment levels of miR-488-3p, miR-625-5p and miR-1197 in Lv-NC or Lv-circ_102002 SNU-790 cells, as determined using qRT-PCR. c Relative expression levels of miR-488-3p, miR-625-5p, and miR-1197 in Lv-NC or Lv-circ_102002 SNU-790 cells and sh-NC or sh-circ_102002 TPC-1 cells, as determined using qRT-PCR. d Relative miR-488-3p levels in SNU-790 cells transfected with NC inh or miR-488-3p inh and in TPC-1 cells transfected with NC mimics or miR-488-3p mimics, as determined using qRT-PCR. e A schematic about the design of luciferase assay. The predicted seed-recognition site in the corresponding circ_102002 sequence are marked out. The circ_102002 reporter with mutant binding site was used as a negative control. f Relative luciferase activity of the circ_102002 reporter plasmid in SNU-790 cells upon miR-488-3p inh or NC inh transfection and TPC-1 cells upon miR-488-3p mimics or NC mimics transfection. The mutant circ_102002 reporter was used as a negative control. g Relative miR-488-3p levels in PTC tissues (tumor, n = 50) and normal adjacent tissues (non-tumor, n = 50), as determined using qRT-PCR. h Pearson’s correlation analysis of the relative expressions between miR-488-3p and circ_102002 (mean ± SEM, *p < 0.05, **p < 0.01).

