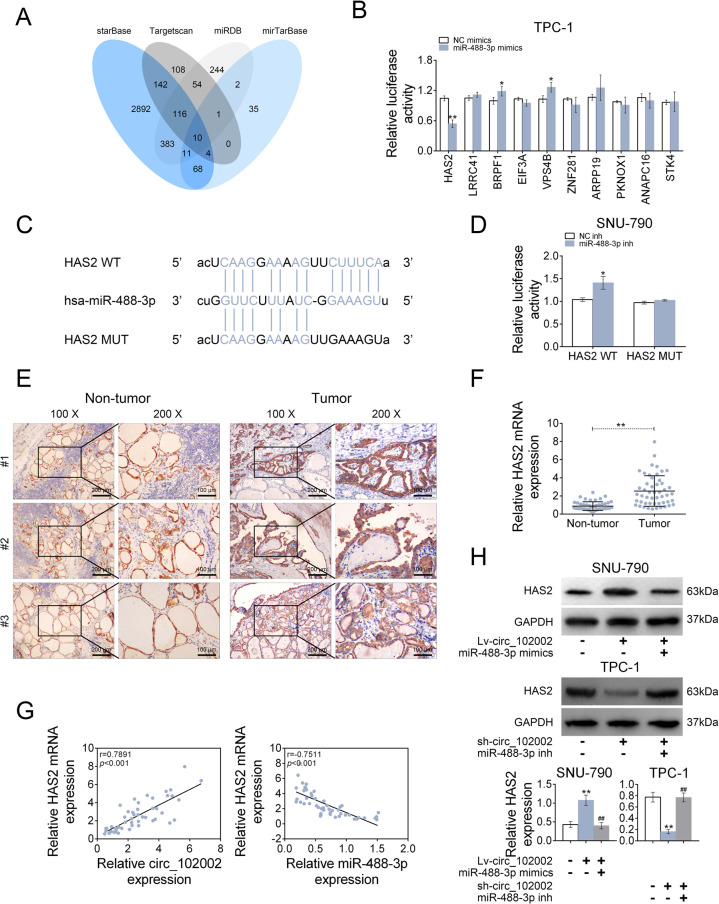
Fig. 5. Hsa_circ_102002 negatively regulates miR-488-3p through upregulating HAS2.
a The intersection of potential genes that could be targeted by miR-488-3p, as predicted by Targetscan, mirTarBase, miRDB and starBase. b Relative luciferase activities of the 3ʹ-UTR reporter plasmids (HAS2, LRRC41, BRPF1, EIF3A, VPS4B, ZNF281, ARPP19, PKNOX1, ANAPC16, and STK4) were measured in TPC-1 cells upon transfection of miR-488-3p mimics or NC mimics. c Seeds match for miR-488-3p in the 3ʹ-UTR of HAS2. The predicted seed-recognition sites in the HAS2 mRNA sequence and the corresponding miR-488-3p sequence are marked in blue. d Relative luciferase activity of the HAS2 3ʹ-UTR reporter plasmid was measured in SNU-790 cells after expressing NC inh or miR-488-3p inh. The mutant HAS2 3ʹ-UTR reporter was used as a negative control. e Representative IHC staining of GAPDH and HAS2 in the PTC tissues (tumor, n = 50) and normal adjacent tissues. Original magnification, ×40 and ×400. f Relative HAS2 mRNA expression levels in PTC tissues (tumor, n = 50) and normal adjacent tissues (non-tumor, n = 50), as determined using qRT-PCR. g Pearson’s correlation analysis of the relative expressions between circ_102002 and HAS2 mRNA, miR-488-3p and HAS2 mRNA in PTC patients. h Protein expression levels of HAS2 in Lv-NC + NC mimics, Lv-circ_102002, Lv-circ_102002+miR-488-3p mimics SNU-790 cells, and in sh-NC + NC inh, sh-circ_102002, sh-circ_102002+miR-488-3p inh TPC-1 cells, as determined using western blotting. Bands were quantified and shown in histogram (mean ± SEM, *p < 0.05, **p < 0.01).

