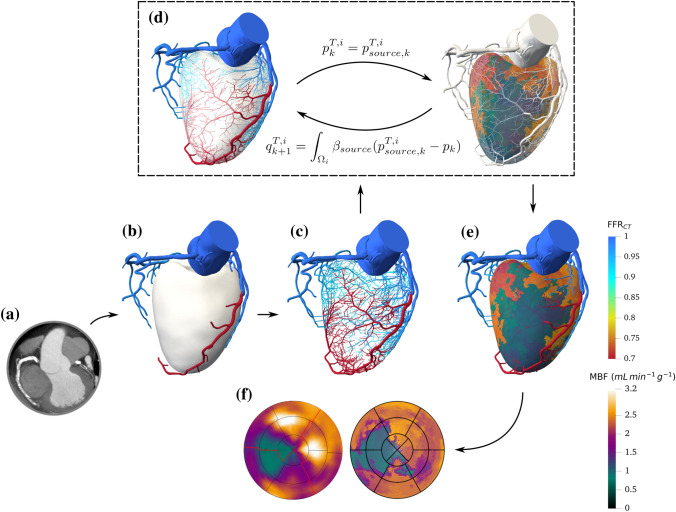
Figure 1.
Illustration of the pipeline for a patient with disease in the left anterior descending coronary artery. (a) CT imaging data. (b) Segmented geometry and analysis. (c) results in segmented and synthetic vasculature. (d) Illustration of the coupling loop, demonstrating quantities exchanged between the coronary model (left) and the myocardium model (right) at coupling iteration k. (e) Hyperemic MBF for coupled model. (f) Comparison of simulated (right) and [O]O PET (left) hyperemic perfusion maps.

