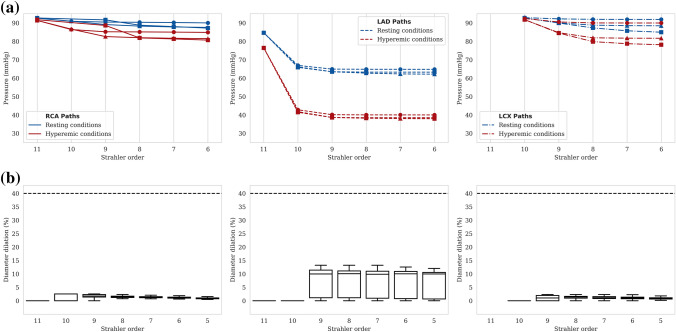
Figure 7.
Pressure and dilation analysis along vasculature for a patient with LAD lesion. (a) Pressure along 3 random paths of each main coronary tree for resting and hyperemic conditions. Each path is differentiated with a circle, triangle or square. (b) Diameter dilation per Strahler order in resting conditions for each coronary tree: RCA (left), LAD (center), LCX (right). The horizontal dotted line represents maximum dilation capacity.

