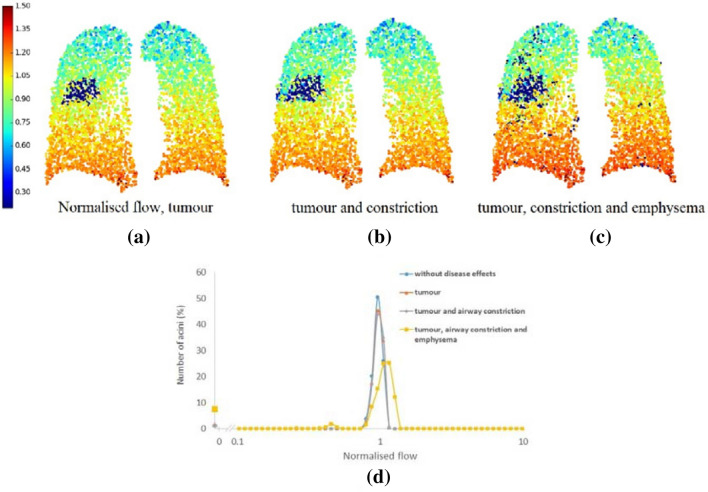
Figure 2.
Changes in ventilation solution in a single patient-based model due to the impact of tumour and emphysema by applying the following impacts: (a) increased acinar stiffness (meaning the lung tissue cannot inflate in the tumour region); (b) increased acinar stiffness and airway constriction; (c) increased acinar stiffness, airway constrictions, and reduced acinar compliance (this reduced compliance mimics the hyperinflated emphysema regions meaning they are harder to inflate). Figures (a) to (c) show 2D cross-section of a coronal slice through the model with the colour spectrum indicating normalised flow values. (d) Shows a histogram plot for the predicted ventilation in acinar units without disease effects and with increased acinar stiffness, increased acinar stiffness and airway constrictions, and three effects combined (increased acinar stiffness, airway constrictions, and reduced acinar compliance). This patient had a tumour volume = 173 cm3, baseline FEV1 % predicted = 75%.

