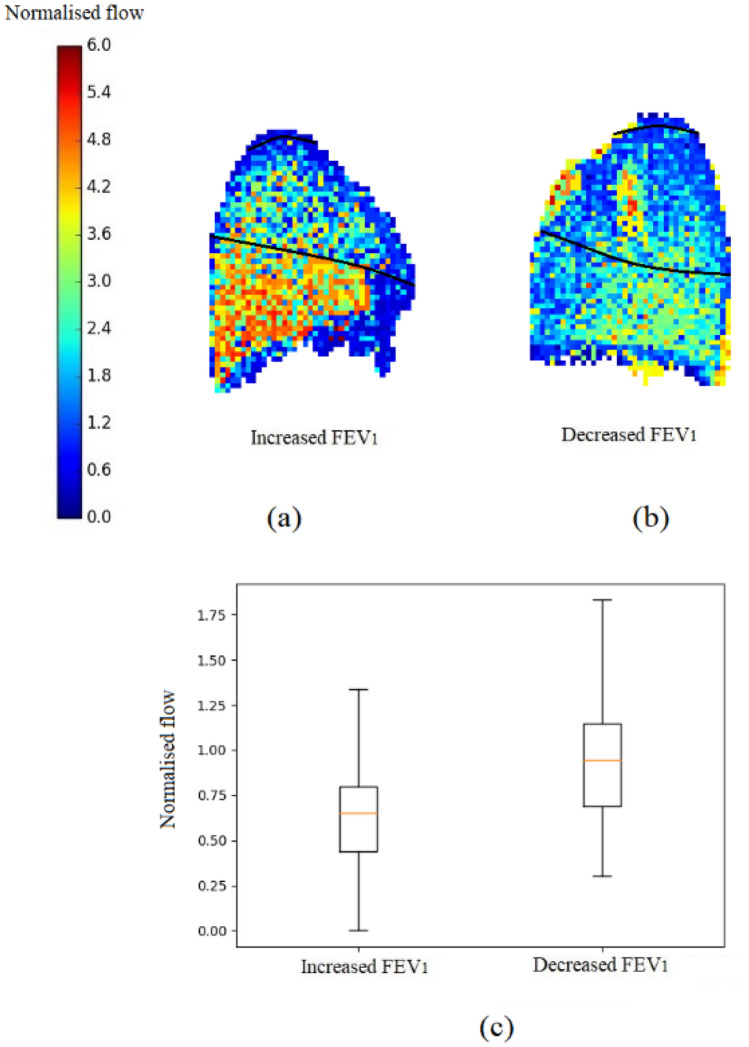
Figure 5.
Demonstration of two patient-based models, despite a very similar V20 in each case (27 and 23% of the total lung, respectively) one patient had an increase in FEV1 and the other a decrease. (a, b) Display a side view of the ipsilateral lung with the sum of the normalised flow (predicted in the models) projected on the plane indicating the ventilation within the 20 Gy dose region (a: = 0.60 and b: = 0.99, these two subjects are outliers observed in Fig. 4b); the black lines (drawn around the upper lung) indicates the isodose area. The patient with decreased FEV1 had higher ventilation (VR20) in the irradiated region. (c) The boxplot shows the distribution of normalised flow in the 20 Gy isodose volume from each model.

